'%3e%3cpath%20d='M14.5584%2010.5857L23.6652%200H21.5072L13.5999%209.19156L7.2843%200H0L9.55034%2013.8992L0%2025H2.1582L10.5087%2015.2935L17.1783%2025H24.4626L14.5582%2010.5857H14.5588H14.5584ZM11.6025%2014.0215L10.6348%2012.6375L2.9357%201.62451H6.25036L12.4638%2010.5123L13.4315%2011.8963L21.5082%2023.4491H18.1935L11.6027%2014.0219V14.0213L11.6025%2014.0215Z'%20fill='%23808182'/%3e%3c/g%3e%3cdefs%3e%3cclipPath%20id='clip0_20_84'%3e%3crect%20width='24.4624'%20height='25'%20fill='white'/%3e%3c/clipPath%3e%3c/defs%3e%3c/svg%3e)
%20is%20a%20leading%20provider%20of%20wealth%20management,%20asset%20servicing,%20asset%20management%20and%20banking%20to%20corporations,%20institutions,%20affluent%20families%20and%20individuals.%20Founded%20in%20Chicago%20in%201889,%20Northern%20Trust%20has%20offices%20in%20the%20United%20States%20in%2019%20states%20and%20Washington,%20D.C.,%20and%2020%20international%20locations%20in%20Canada,%20Europe,%20the%20Middle%20East%20and%20the%20Asia-Pacific%20region.%20%3c/desc%3e%3cpath%20fill='%233d4042'%20d='M21,21H17V14.25C17,13.19%2015.81,12.31%2014.75,12.31C13.69,12.31%2013,13.19%2013,14.25V21H9V9H13V11C13.66,9.93%2015.36,9.24%2016.5,9.24C19,9.24%2021,11.28%2021,13.75V21M7,21H3V9H7V21M5,3A2,2%200%200,1%207,5A2,2%200%200,1%205,7A2,2%200%200,1%203,5A2,2%200%200,1%205,3Z'%3e%3c/path%3e%3c/svg%3e)
%20-%20https://sketch.com%20--%3e%3ctitle%3eEmail%3c/title%3e%3cdesc%3eShare%20article%20via%20email%3c/desc%3e%3cg%20id='Article'%20stroke='none'%20stroke-width='1'%20fill='none'%20fill-rule='evenodd'%3e%3cg%20id='article-desktop'%20transform='translate(-291.000000,%20-905.000000)'%20fill='%233d4042'%20fill-rule='nonzero'%3e%3cg%20id='Group-3'%20transform='translate(280.000000,%20700.000000)'%3e%3cpath%20d='M12.5859376,205%20L25.5,216.098563%20L38.4140625,205%20L12.5859376,205%20Z%20M11,206.352162%20L11,221.582916%20L19.5446429,213.697123%20L11,206.352162%20Z%20M40,206.352162%20L31.4553572,213.697123%20L40,221.582916%20L40,206.352162%20L40,206.352162%20Z%20M21.1197917,215.049268%20L12.5212054,223%20L38.4787946,223%20L29.8802084,215.049268%20L26.1688988,218.240388%20C25.7827601,218.567837%2025.21724,218.567837%2024.8311012,218.240388%20L21.1197917,215.049268%20L21.1197917,215.049268%20Z'%20id='Shape'%3e%3c/path%3e%3c/g%3e%3c/g%3e%3c/g%3e%3c/svg%3e)
'%20fill='%233d4042'%20fill-rule='nonzero'%3e%3cpath%20d='M317.048444,961%20C318.677807,961.001791%20319.998224,962.333083%20320,963.975866%20L320,963.975866%20L320,972.789759%20C320,973.478748%20319.446027,974.037283%20318.762667,974.037283%20L318.762667,974.037283%20L313.420222,974.037283%20L313.420222,980.619276%20C313.466211,981.335082%20312.928257,981.953082%20312.218333,982%20L312.218333,982%20L298.781667,982%20C298.071743,981.953082%20297.533789,981.335082%20297.579778,980.619276%20L297.579778,980.619276%20L297.579778,974.037283%20L292.237333,974.037283%20C291.553973,974.037283%20291,973.478748%20291,972.789759%20L291,972.789759%20L291,963.975866%20C291.001776,962.333083%20292.322193,961.001791%20293.951556,961%20L293.951556,961%20Z%20M311.486889,970.525371%20L299.513111,970.525371%20L299.513111,980.050743%20L311.486889,980.050743%20L311.486889,970.525371%20Z%20M314.395276,962.742345%20C313.970645,962.65481%20313.549254,962.905694%20313.420222,963.322865%20C313.394809,963.404999%20313.380715,963.490265%20313.378333,963.576269%20C313.380722,963.661209%20313.394821,963.7454%20313.420222,963.826423%20C313.529012,964.18316%20313.855609,964.426832%20314.225778,964.427444%20C314.659193,964.427644%20315.022348,964.096906%20315.066078,963.66215%20C315.109809,963.227395%20314.819907,962.829881%20314.395276,962.742345%20Z%20M317.130097,962.784571%20C316.813535,962.651298%20316.448506,962.723595%20316.20547,962.967701%20C315.962434,963.211807%20315.889338,963.579564%20316.020315,963.899239%20C316.151293,964.218915%20316.460504,964.427444%20316.803556,964.427444%20L316.803556,964.427444%20C317.274992,964.425655%20317.651006,964.045094%20317.651006,963.576269%20C317.652304,963.230394%20317.44666,962.917844%20317.130097,962.784571%20Z%20M311.783656,955%20C312.500482,955.040538%20313.043667,955.574507%20312.997231,956.192982%20L312.997231,956.192982%20L312.997231,959%20L297.002769,959%20L297.002769,956.192982%20C296.956333,955.574507%20297.499518,955.040538%20298.216344,955%20L298.216344,955%20Z'%20id='icon-print'%3e%3c/path%3e%3c/g%3e%3c/g%3e%3c/svg%3e)
April 2026
By Peter Mladina, Executive Director of Portfolio Research, Wealth Management and
Charles Grant, Director of Asset Allocation Research, Wealth Management
Investment risk is the likelihood and magnitude of actual returns differing unfavorably from the expected return — or from a zero percent return for loss-averse investors. Risk is always present, even during benign risk environments and long bull markets when investors often become complacent. It manifests episodically and unpredictably as poor returns. We will show that there are many ways to measure and evaluate risk, but they all seem to capture the same underlying phenomenon of risk — at least at the level of asset classes and portfolios where there is less idiosyncratic risk.1
Investors are risk-averse, meaning they prefer less risk for the same return. Risk capacity is the financial capacity to bear losses without affecting consumption needs. Risk tolerance is the psychological ability to bear losses. Investors should consider both their risk capacity and risk tolerance, as they are not always the same.
We can decompose total risk into modeled risk and model uncertainty. Modeled risk is the risk you can quantify, captured by various risk statistics, which is what we discuss in this research article. These risk statistics are typically calculated over some historical time period and assumed to be good forward-looking risk estimates. Model uncertainty is the risk that your risk quantification is wrong due to parameter uncertainty, regime changes or faulty assumptions. Thus, total risk is generally higher than modeled risk, though this can be mitigated with conservative risk statistics.
Exhibit 1 shows the risk parameters (standard deviations and correlations) for the 10 major asset classes we use in our strategic asset allocation process.2 Riskier assets like global equity have higher standard deviations (volatility risk) than safer assets like investment-grade bonds. Asset class standard deviations and correlations (the degree of co-movement in asset returns) both contribute to a diversified, multi-asset-class portfolio’s standard deviation — the risk that should matter most to investors.
Exhibit 1 – Risk Parameters for Strategic Asset Classes
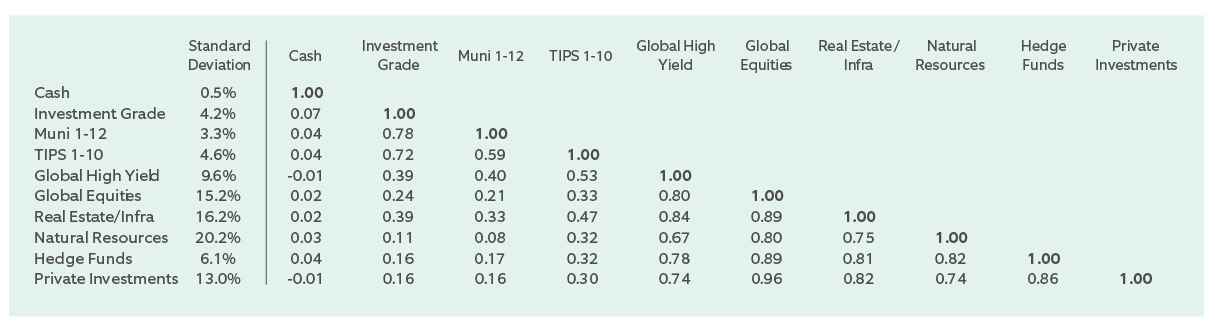
We discuss three categories of risk statistics: volatility risk (dispersion), tail risk (significant loss) and funding risk (failing to fund liabilities or goals). Standard deviation is the risk statistic most commonly used by investors, perhaps because of how investment theory evolved and its ease of use mathematically. Standard deviation measures the degree of dispersion around the mean (the expected return). Common criticisms of standard deviation are that it is unintuitive, investors only care about the downside when measuring risk and asset returns do not follow a normal distribution (i.e., they are skewed or fat-tailed). Therefore, some investors prefer semi-deviation, which measures the degree of dispersion below the expected return, or downside deviation, which measures the degree of dispersion below zero. One issue with semi-deviation and downside deviation is that they can underestimate the future risk of risky assets that have historically performed well.
Conditional value at risk (CVaR 5%) is a tail-risk statistic that measures the average of the worst five percent of returns in a return series or probability distribution. Value at risk (VaR 5%) is closely related; it is simply the fifth percentile return. Maximum drawdown measures the peak-to-trough return of a historical return series. One issue with tail-risk statistics is that they are based on limited information, which reduces their reliability for forward-looking risk estimation. For example, CVaR (5%) employs only five percent of the available returns data, a major weakness for assets without really long return histories. Historical and hypothetical stress tests are additional ways to evaluate the risk of significant loss.
Funding risk is the risk of failing to fund liabilities or lifetime goals. Tracking error measures the degree of dispersion relative to an asset that can fund the liability risk-free. Tracking error manifests through time as dispersion in future funding outcomes — i.e., dispersion in future shortfall and surplus. The ICAPM market beta measures an asset’s sensitivity to excess market risk (i.e., equity risk in excess of the risk-free funding asset).3 All else equal, a higher ICAPM market beta results in more tracking error. Funding risk is additionally quantified with Monte Carlo simulation, which produces additional summary risk statistics such as shortfall probability and average shortfall magnitude. Investors with liabilities or goals have a richer set of risk statistics to consider.
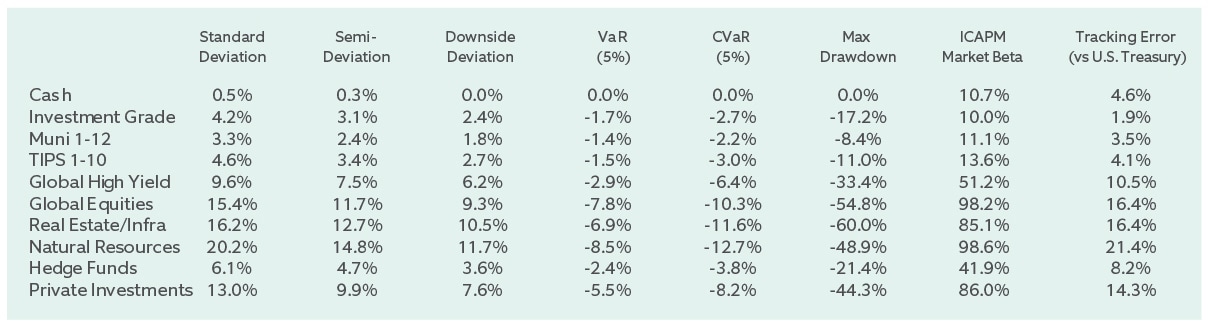
We calculate these risk statistics from the historical returns of 14 asset classes we use in our strategic asset allocation process, and 26 multi-asset-class portfolios (investment objectives) that result from that process.4 Exhibit 2 shows these risk statistics for the 10 major strategic asset classes in Exhibit 1.5
Exhibit 2 – Asset class Risk Statistics
Next, we inspect the correlations between risk statistics across these asset classes and portfolios to see if any are meaningfully different from each other and from standard deviation, the standard measure of portfolio risk. If correlations are low, then each risk statistic contains unique information about risk. Exhibit 3 shows the correlation matrix of risk statistics across our sample of asset classes and portfolios.6 A correlation of 1.00 means two variables (two risk statistics here) are perfectly correlated, while a correlation greater than 0.80 is very high.
Exhibit 3 – Correlations of Risk Statiistics
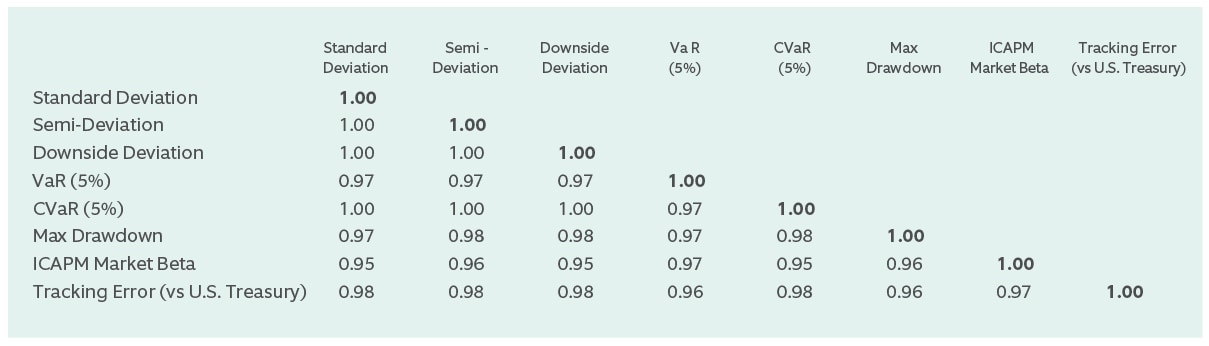
The average pairwise correlation across all eight risk statistics is 0.98. All risk statistics are nearly perfectly correlated with each other, suggesting they all capture the same fundamental phenomenon of risk. Semi-deviation and downside deviation are perfectly correlated with standard deviation, so they do not convey different downside information about risk than standard deviation. The tail-risk statistics (CVaR, VaR, and max drawdown) and funding-risk statistics (tracking error and ICAPM market beta) are also all very highly correlated with each other, and with standard deviation.
As a robustness check, we repeat our test on 186 investment products (funds and separately managed accounts) on the Wealth Management investment platform that have returns spanning the same 23-year history as our asset classes and portfolios. The average pairwise correlation is 0.97. The results are nearly identical.
Ultimately, most investors own diversified, multi-asset-class portfolios, and it is the risk of these portfolios that matters most. For asset-only investors (those without explicit liabilities or goals), standard deviation is the standard definition of portfolio risk, and the results in Exhibit 2 support that choice, as no other risk statistic conveys materially different information about risk. Additionally, standard deviation is the risk statistic used in asset-only Monte Carlo simulation, where both future downside and upside portfolio outcomes offer useful information for decision-making.
For liability and goal-relative investors, tracking error is the standard definition of portfolio risk, and our results support that choice as well. The selection of tracking error improves the risk management of liability funding, a dimension of risk that goes beyond just returns. Tracking error is the risk statistic used in liability-relative Monte Carlo simulation, where both future shortfall and surplus outcomes provide critical information on liability funding.
Although all of the risk statistics are highly correlated, they do offer different frames of reference for interpreting risk. Framing risk in different ways can help improve portfolio selection and risk management, particularly for investors who are not statistically inclined. Risk frames include not only the various risk statistics but also stress tests and Monte Carlo simulation to provide a more comprehensive view of risk.
Peter Mladina
Executive Director of Portfolio Research, Wealth Management
%20scale(1,%20-1)%20rotate(-90.000000)%20translate(-22.445237,%20-21.357547)%20'%20points='21.2928054%2010.2071946%2022.707019%208.79298104%2030.8809213%2016.9668834%2015.4904479%2033.9221138%2014.0095521%2032.5778862%2028.119%2017.034'%3e%3c/polygon%3e%3c/g%3e%3c/svg%3e)