
Asset Servicing | March 2, 2026
Midterm Elections & US Markets: A Guide
What history suggests for US financial markets during the upcoming congressional midterm elections
The 2026 US congressional midterm elections arrive at a moment when the stakes—for policy, governance, and markets—are unusually high. The outcome will shape how far the Trump administration can advance its economic program and how constrained it may become by a potentially divided or unified Congress. At the same time, political commentators have highlighted that a change in control of the House and Senate could influence the likelihood and intensity of future investigations or impeachment efforts, further amplifying perceived political risk.
For investors, however, midterms have historically mattered in ways that go beyond any single administration. Empirical research shows that political uncertainty and required risk premia tend to run higher around midterm elections than during presidential election years themselves, even though presidential contests attract far more public and media attention. Historically, the four-year presidential election cycle stands out as the most prominent cyclical pattern in US equity markets, with midterm years playing a disproportionately important role in shaping subsequent returns.
In this paper, I draw on academic studies of past presidential and midterm cycles to summarize how markets have behaved around these events and why. The goal is not to make forecasts, but to use history and statistical analysis to better frame what investors might reasonably expect as the upcoming midterm election year unfolds, before and after the midterm elections.
Prominence of the Presidential Cycle
The presidential cycle stands out as a prominent historical pattern in US equity and bond markets. Spanning the full four-year presidential term, markets exhibit remarkable similarities in price trends and risk premia through each year of a president’s administration. A study of market returns from1965 to 2003 by Wong & McAleer (2009) identified several different market cycles but found that the presidential election cycle was the most dominant. “The result of the spectral analysis indicated that stock prices in the USA exhibited several cycles, with the four‑year Presidential Election Cycle being the most prominent cycle, with the strongest spikes being spaced at about 200 weeks (or around 4 years) apart.”1
The other historical cycles examined by Wong and McAleer—such as the 28-day lunar cycle or the January effect—lack the same consistency and strength. “Six interesting cyclical patterns are worthy of note: 28‑day Trading Cycle (the Lunar Cycle), 10.5‑month Futures Cycle, January Effect, 4‑year Cycle (the Kitchin Cycle and the Presidential Election Cycle), 9.2‑year Cycle (the Juglar Cycle), and 54‑year Cycle (the Kondratieff Cycle).”2 Their research also noted that the pattern holds across administrations during the time period examined.
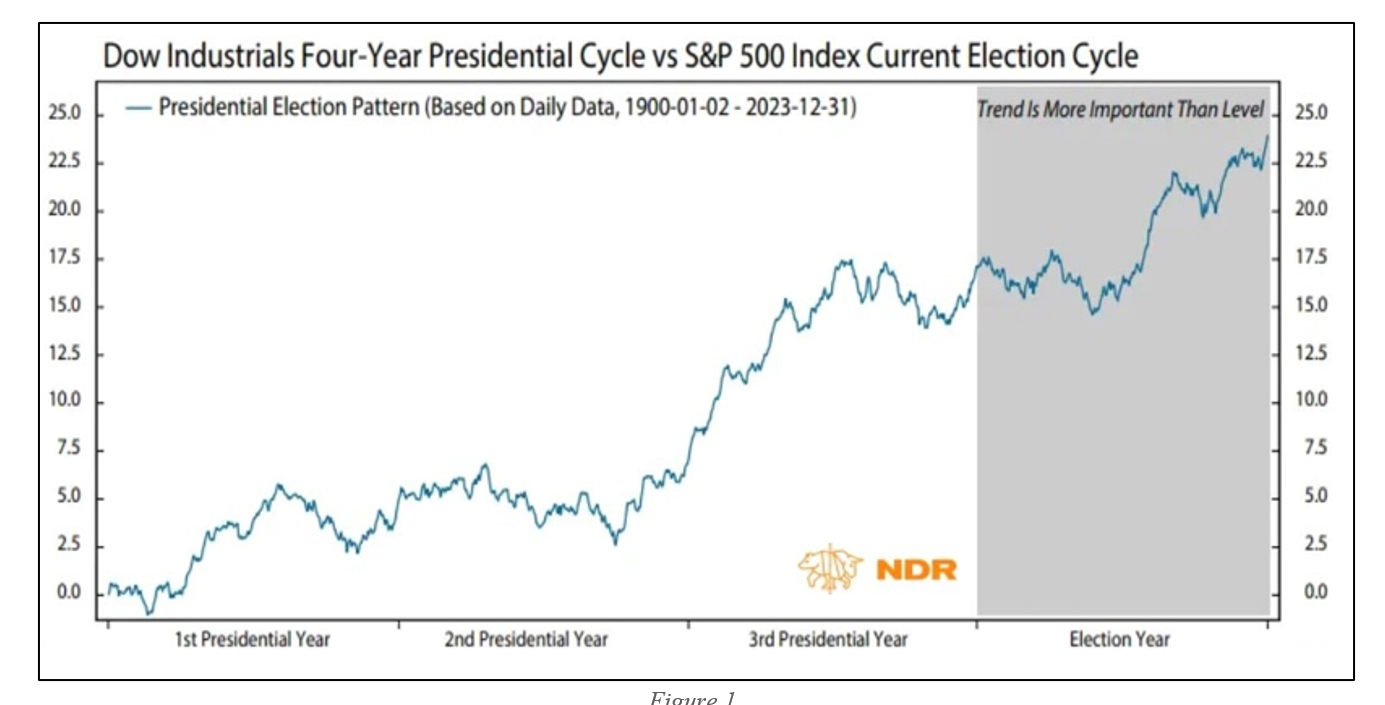
The presidential cycle can be visualized on the accompanying figure from NDR. Historically, stock prices moderate in advance of both the midterm and presidential elections, with a rally ensuing as voter outcomes become clear. On average, stock prices fall before presidential and midterm elections, then rally after them with the market returns highest in the third and fourth years. The patterns have been observed in most periods: 18 out of 20 sub-periods studied by Wong & McAleer in 2009 exhibited the expected signs of this cycle, with 15 periods deemed to be statistically significant.
Cycle Across Caps and Parties
Many other studies have confirmed the significance of the presidential cycle. For example Booth et al (2003) “confirm previous findings that both large-cap and small-cap stock returns in the US exhibit a presidential cycle pattern, i.e. returns are significantly higher in the last 2 years than in the first 2 years of the presidential term.”3 The prominence of the presidential cycle extends beyond party lines and market capitalizations. The study from Booth et al (2003) found that fixed income securities tend to perform better during Republican administrations, ostensibly owing to a different policy approach to government spending, but that “large and small stock returns are not significantly different from each other” during the period studied.
This presidential cycle effect persists even after accounting for political variables: "the presidential cycle effect prevails even after controlling for variables such as which political party is in power or whether a candidate is the incumbent president or not." In confirming the cycle, Booth et al also found that it is closely intertwined with the business cycle, implying a possible connection between business and political cycles or potential systemic economic behaviors tied to the election timeline.
Midterms Outpace Presidential Elections in Impact
While the presidential election attracts most of the attention, it’s often the Congressional midterm elections that exert a stronger influence on financial markets. While media and voter attention is most acute around the election of a president, market behavior tends to respond more sharply to the political uncertainty surrounding midterms. In the months leading up to a midterm election, equity premiums typically rise as investors demand greater compensation for risk, while Treasury spreads tighten in a clear risk-off move. As the results become clearer to investors, the return of policy clarity tends to lift equities in a renewed risk-on environment. A similar pattern emerges during presidential elections, but history shows that midterms consistently produce the more pronounced market reaction.
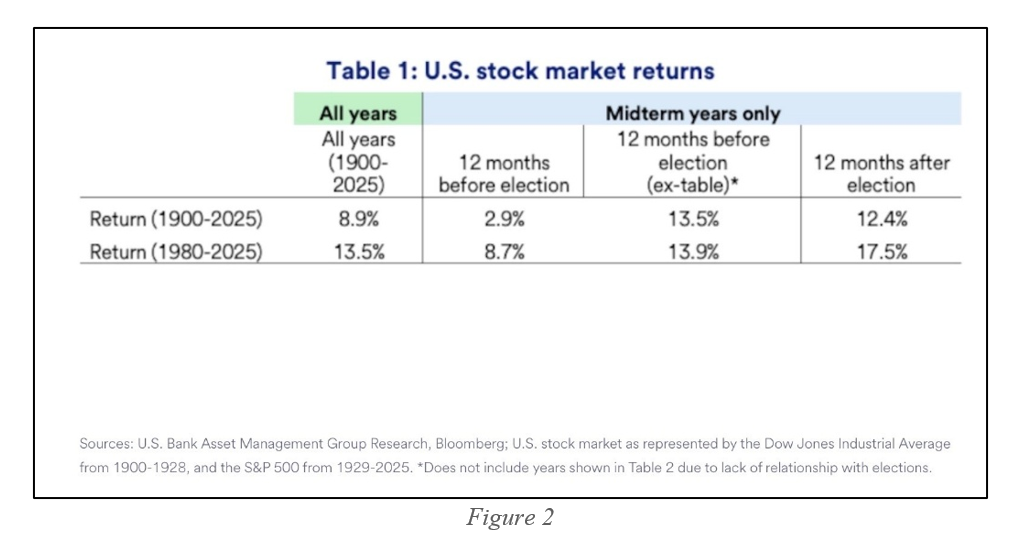
An analysis of US equity returns from both 1900 and 1980, as conducted by US Bank Asset Management, illustrates the average returns generated before and after midterm elections. Their study documented the effect has persisted into more recent history.
In a comprehensive study of 200 years of historical market data, Chan and Marsh (2023) confirm the presidential cycle and document higher aggregate returns after midterm elections than in comparable periods. They noted: “U.S. equity premiums over the past two centuries have been significantly higher on average in months following midterm Congressional elections but not at other times in the Presidential cycle." And in fact, Chan & Marsh even go so far as to state that “almost 98% of the average monthly equity premium over our two-century sample periods is earned in months following the midterms, while these months constituted merely one-tenth of the sample period”.4
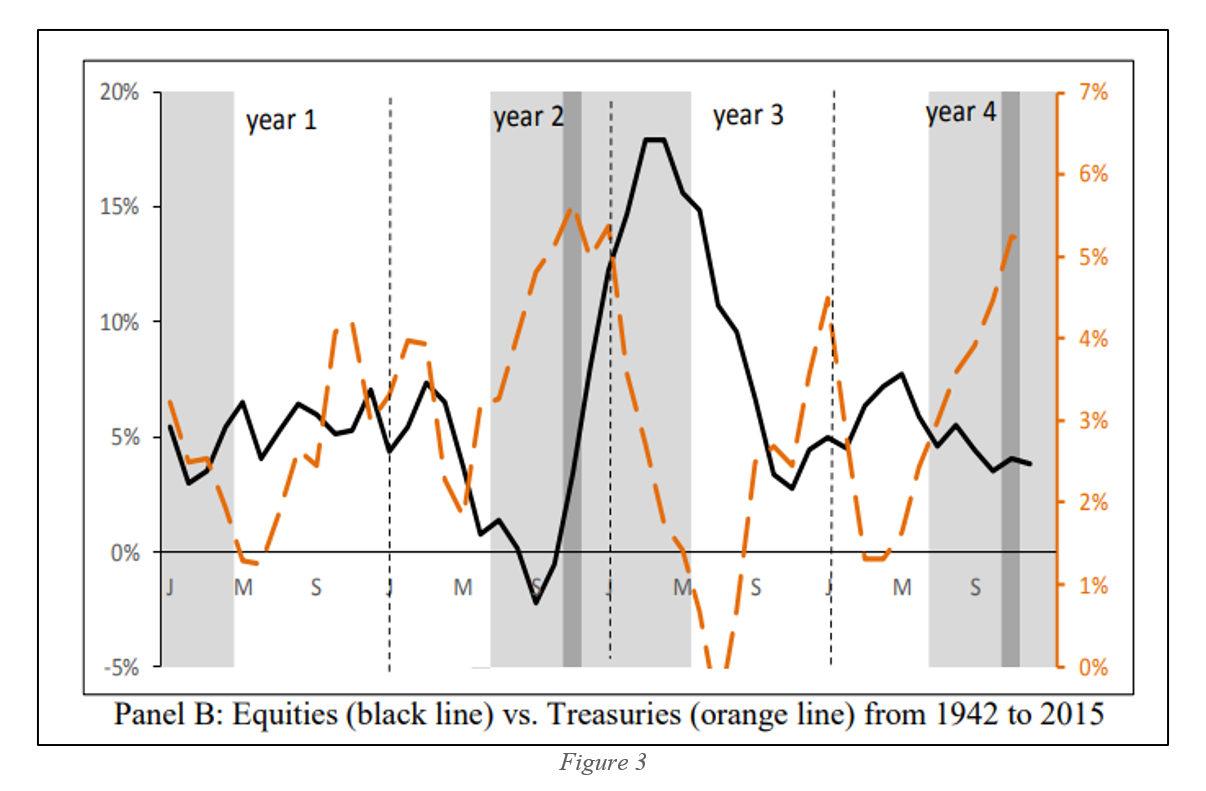
The graphic below from Chan, Marsh (2023) illustrates how the presidential cycle has unfolded in equity and treasury markets in the modern, post-WWII era. The solid black line, representing US stocks, shows the decline in equity prices before both biannual elections, with a subsequent rally afterwards. Note how much more pronounced the movements are for the midterm elections (in year 2) versus the presidential election (in year 4). The dark gray areas represent election month, whereas the light gray shading covers the five-month periods before and after. This strength of the midterm rally is clearly evident in Figure 3 from the Chan, Marsh study.
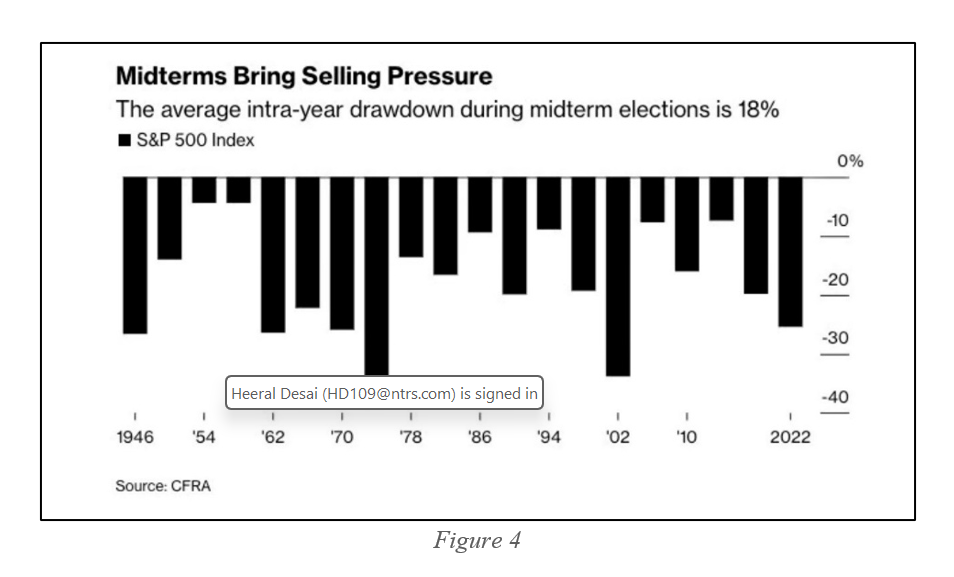
A further review of the post-WWII midterm elections by CFRA Research found that the average intra-year drawdown of the S&P 500 Index is 18%.
Supporting Stock-Bond Dynamics
Additional studies reinforce the cycle through shifting stock-bond correlations, driven by risk aversion. Demirier & Gupta (2018) also examined two centuries of data and found that the correlation between stocks and bonds are sensitive to political conditions, and presidential cycles help explain some of this linkage: "We document a presidential cycle effect on stock‑bond market correlations."5 This aligns with risk-off behavior pre-midterm and a risk-on surge afterward. “Given the findings… that presidential cycles are driven by the level of risk aversion among market participants, which in turn, drive risk premia in financial returns…” "Our findings empirically validate the presidential cycle effect on return correlations."6
Risk as the Hidden Engine of the Cycle
At the heart of the midterm effect lies risk—specifically, political uncertainty and its impact on investor behavior. Demirer & Gupta show that stock‑bond correlations vary with the presidential cycle, reflecting shifting risk preferences among investors. They attribute these changes to evolving levels of risk aversion, which drive fluctuations in risk premia across asset classes.
Recent research reinforces that the midterm election effect is not a market anomaly but a rational compensation for risk. Chan and Marsh (2023) find that once risk adjustments are accounted for using the standard capital asset pricing model (CAPM) model, the excess midterm return largely disappears.
Higher returns around midterms compensate for elevated political risk, often overlooked by investors. “Prices mainly rise because of a reduction in uncertainty about political agendas in the months following an election.”7
Midterms experience a larger spike in economic policy uncertainty (e.g. the EPU index) than presidential years, raising equity premia and volatility. A key driver is uncertainty over House/Senate control, which in turn affects taxes, spending, and regulatory policies—leading to potential gridlock or a more unified government. Chan and Marsh view this as tail risk: low-probability, high-impact policy shifts demand premia, explaining pre-midterm volatility and post-midterm strength.
One way of thinking about how government policy changes investor sentiment is proposed by Pastor and Veronesi (2013). Their model explains that political events create extra risk premiums in stocks, especially pronounced during bad economic times, though a policy choice framework, in which investor expectations and uncertainty vary based upon government policy decisions. Put simply, the model underpins the presidential cycle effect: the government selects a policy, but investors face uncertainty over outcomes, amplifying risk premia in weak economies. And there is a persistent pattern around pre-announced elections.8 Changes in political leadership affect expected stock returns through their impact on perceived economic policy risk and disaster risk, thus generating political cycles in risk premia.”9
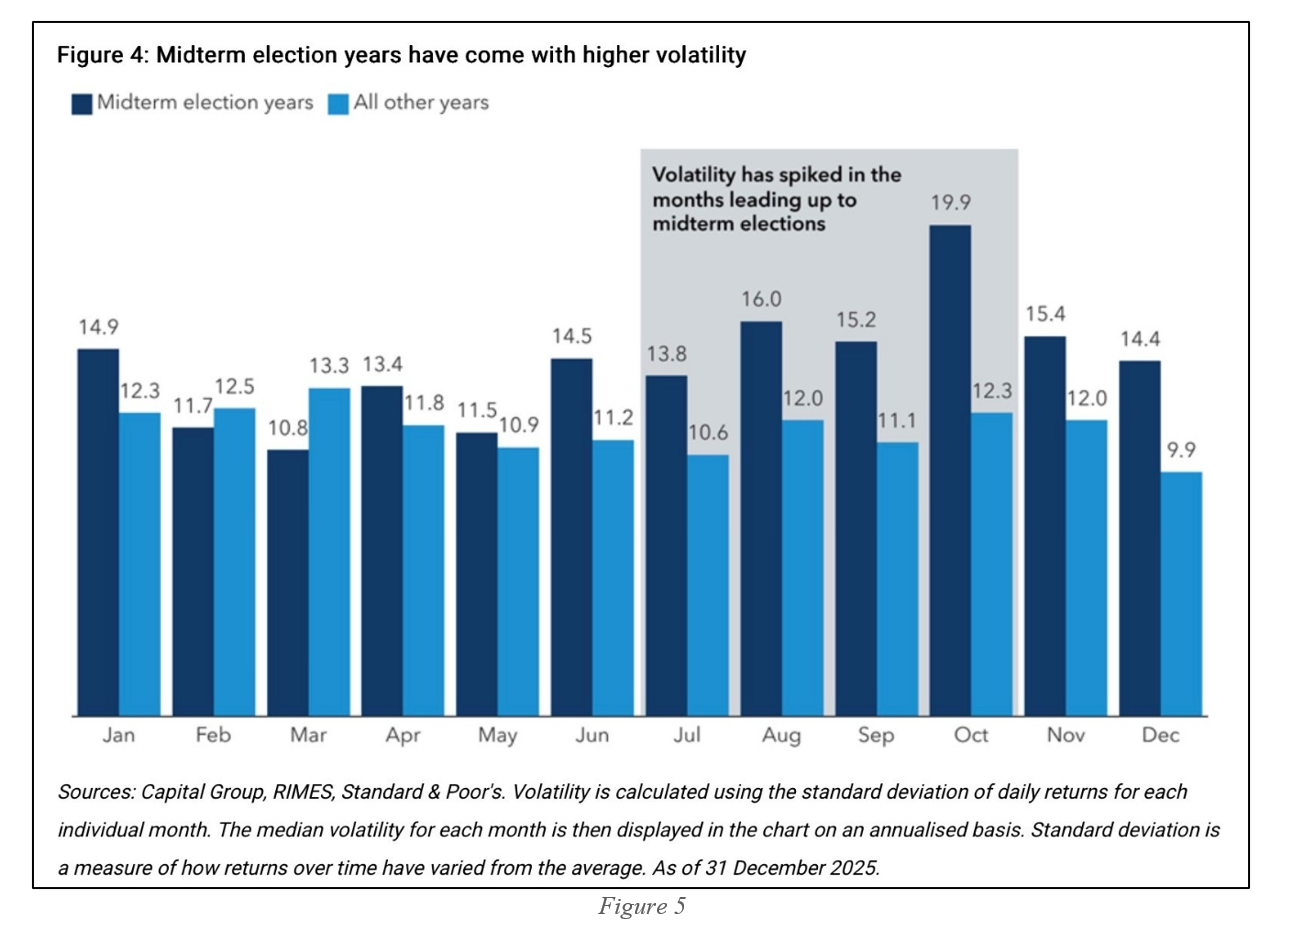
The market’s appraisal of rising risks is apparent in the below analysis of daily return volatility in the months leading up to the midterm election. Historically, risks begin to manifest in daily volatility in the spring, as illustrated in the figure from Capital Group. Volatility is elevated in midterm election years across all months throughout the year outside of February and March.
What This Means for the Upcoming Cycle
As the next midterm election approaches, the historical template suggests the following pattern:
- Increased volatility and equity risk premiums in the six to eight months leading up to November, reflecting rising policy uncertainty. Studies suggest that volatility picks up as early as April, but no later than June, in most midterm election years.
- Temporary bond strength, driven by flight-to-safety behavior as investors hedge political and fiscal risks. Treasury spreads tend to begin tightening around May based upon historical analysis.
- A potential market bottom in the late summer or early fall as uncertainty peaks. The bottom varies depending upon the clarity of voter sentiment. If pre-election polls are especially tight, the bottom tends to come closer to the date of the election.
- A strong post-election relief rally, as clarity over congressional control and policy direction reduces required risk premia. The six-month period following midterm elections was found by Chan and Marsh to be the highest return period during the four-year cycle.
This pattern has repeated across political eras, from industrializing America to the information age. The reason is not partisanship, but human behavior: markets naturally discount uncertainty—and reprice opportunity—around inflection points in governance.
Conclusion
Taken together, the literature points to the US presidential election cycle as the most prominent and robust cyclical pattern in historical equity returns, with evidence spanning up to two centuries of data and multiple asset classes. Within that four‑year structure, the congressional midterm period stands out as the most consequential phase for markets, even more so than the presidential election that tends to dominate media and voter attention.
Across cycles, midterm years are typically marked by equity market weakness and elevated volatility from the spring—often around April—into the fall, as equity risk premia rise and markets re‑rate in response to growing political uncertainty and policy risk. Once midterm outcomes become clearer, usually between September and November, that uncertainty recedes, risk premia compress, and equities have historically delivered strong returns over the subsequent six months as the “post‑midterm flood of public information” is absorbed and the traditional relation between beta and expected returns reasserts itself.10
The unifying explanation across studies is that political uncertainty is typically highest during the midterm election season, especially around the configuration of Congress and the resulting balance of power over taxation, spending, and regulation. In the language of models such as Pastor and Veronesi (2013), investors demand higher compensation for bearing this time‑varying policy and disaster risk, so midterm periods embed elevated risk premia that are then released as uncertainty resolves—producing the characteristic pattern of pre‑midterm caution and post‑midterm strength documented across US financial markets.
1 Wong, Wing-Keung, and Michael McAleer. 2009. “Mapping the Presidential Election Cycle in US Stock Markets.” *Mathematics and Computers in Simulation* 79 (11): 3267–3277.
2 Wong, Wing-Keung, and Michael McAleer. 2009. “Mapping the Presidential Election Cycle in US Stock Markets.” *Mathematics and Computers in Simulation* 79 (11): 3267–3277.
3 Booth, James and Lena Chua Booth. 2003. “Is presidential cycle in security returns merely a reflection of business conditions?”. *Review of Financial Economics* Vol 12, Issue 2: 131-159.
4 Booth, James and Lena Chua Booth. 2003. “Is presidential cycle in security returns merely a reflection of business conditions?”. *Review of Financial Economics* Vol 12, Issue 2: 131-159.
5 Chan, Kam Fong, Ian W. Marsh, and Qingwei Wang. 2023. “Midterm Elections and Stock Returns.” *Finance Research Letters* 54: 103735.
6 Demirer, Riza, and Rangan Gupta. 2018. “Presidential Cycles and Time-Varying Bond–Stock Market Correlations: Evidence from More than Two Centuries of Data.” *Economics Letters* 171: 85–89.
7 Demirer, Riza, and Rangan Gupta. 2018. “Presidential Cycles and Time-Varying Bond–Stock Market Correlations: Evidence from More than Two Centuries of Data.” *Economics Letters* 171: 85–89.
8 Anderson, Warwick, Jedrzej Bialkowski and Mortiz Wagner. 2023. “The midterm election effect on US stock returns: Some practical considerations for investors.” *University of Cantebury* Working Paper No. 5/2023.
9 Kelly, Bryan, Lubos Pastor, and Pietro Veronesi. 2016. “The Price of Political Uncertainty: Theory and Evidence from the Option Market.” *Journal of Finance* 71 (5): 2417–2480. (NBER Working Paper 19812 version, 2014.)
10 Chan, Kam Fong, and Terry A. Marsh. 2018. “Equity Premiums in the Presidential Cycle: The Midterm Election Resolution of Uncertainty.” SSRN Working Paper, last revised April 26, 2018.
Meet Your Expert
Grant Johnsey
Grant is responsible for delivering capital market solutions to institutional clients across agency brokerage, transition management, security finance, and foreign exchange.

Northern Trust Securities, Inc.(NTSI), Member FINRA, SIPC and a subsidiary of Northern Trust Corporation. Products and services offered through NTSI are not FDIC insured, not guaranteed by any bank, and are subject to investment risk including loss of principal amount invested. Additional disclosures are included in the link, see http://www.northerntrust.com/ntsidisclosure
Business Continuity Notice- Northern Trust Securities, Inc.
© 2026 Northern Trust Corporation. Head Office: 50 South La Salle Street, Chicago, Illinois 60603 U.S.A. Incorporated with limited liability as an Illinois corporation under number 0014019. Products and services provided by subsidiaries of Northern Trust Corporation may vary in different markets and are offered in accordance with local regulation. This material is directed to professional clients (or equivalent) only and is not intended for retail clients and should not be relied upon by any other persons. This information is provided for informational purposes only and does not constitute marketing material. The contents of this communication should not be construed as a recommendation, solicitation or offer to buy, sell or procure any securities or related financial products or to enter into an investment, service or product agreement in any jurisdiction in which such solicitation is unlawful or to any person to whom it is unlawful. This communication does not constitute investment advice, does not constitute a personal recommendation and has been prepared without regard to the individual financial circumstances, needs or objectives of persons who receive it. Moreover, it neither constitutes an offer to enter into an investment, service or product agreement with the recipient of this document nor the invitation to respond to it by making an offer to enter into an investment, service or product agreement. For Asia-Pacific markets, this communication is directed to expert, institutional, professional and wholesale clients or investors only and should not be relied upon by retail clients or investors. For legal and regulatory information about our offices and legal entities, visit northerntrust.com/disclosures. The views, thoughts, and opinions expressed in the text belong solely to the author, and not necessarily to the author's employer, organization, committee or other group or individual.
The following information is provided to comply with local disclosure requirements: The Northern Trust Company, London Branch, Northern Trust Global Investments Limited, Northern Trust Securities LLP, Northern Trust Global Services SE UK Branch and Northern Trust Investor Services Limited, 50 Bank Street, London E14 5NT, are authorised and regulated by the UK’s Financial Conduct Authority. The Northern Trust Company, London Branch and Northern Trust Global Services SE UK Branch are also authorised and regulated by the UK’s Prudential Regulation Authority. Not all of the products and services mentioned within this material are authorised and regulated by the UK’s Financial Conduct Authority or UK’s Prudential Regulation Authority. Northern Trust Global Services SE, 10 rue du Château d’Eau, L-3364 Leudelange, Grand-Duché de Luxembourg, incorporated with limited liability in Luxembourg at the RCS under number B232281; authorised by the ECB and subject to the prudential supervision of the ECB and the CSSF; Northern Trust Global Services SE UK Branch, UK establishment number BR023423 and UK office at 50 Bank Street, London E14 5NT; Northern Trust Global Services SE Sweden Bankfilial, Ingmar Bergmans gata 4, 1st Floor, 114 34 Stockholm, Sweden, registered with the Swedish Companies Registration Office (Sw. Bolagsverket) with registration number 516405-3786 and the Swedish Financial Supervisory Authority (Sw. Finansinspektionen) with institution number 11654; Northern Trust Global Services SE Netherlands Branch, Viñoly 6th & 7th floor, Claude Debussylaan 16A-18A, 1082 MD Amsterdam, the Netherlands. Subject to regulation in the Netherlands by De Nederlandsche Bank and Autoriteit Financiële Markten. Northern Trust Global Services SE Abu Dhabi Branch, registration Number 000000519 licenced by ADGM under FSRA #160018; Northern Trust Global Services SE NUF, org. no. 925 952 567 (Foretaksregisteret), address Third Floor, Haakon VIIs gate 6 0161 Oslo, is a Norwegian branch of Northern Trust Global Services SE supervised by Finanstilsynet. Northern Trust Global Services SE Leudelange, Luxembourg, Zweigniederlassung Basel is a branch of Northern Trust Global Services SE. The Branch has its registered office at Grosspeter Tower, Grosspeteranlage 29, 4052 Basel, Switzerland, and is authorised and regulated by the Swiss Financial Market Supervisory Authority FINMA. The Northern Trust Company Saudi Arabia, PO Box 7508, Level 20, Kingdom Tower, Al Urubah Road, Olaya District, Riyadh, Kingdom of Saudi Arabia 11214-9597, a Saudi Joint Stock Company – capital 52 million SAR. Regulated and Authorised by the Capital Market Authority License #12163-26 CR 1010366439. Northern Trust (Guernsey) Limited (2651) (NTGL)/Northern Trust Fiduciary Services (Guernsey) Limited (29806) (NTFSGL)/Northern Trust International Fund Administration Services (Guernsey) Limited (15532) (NTIFASGL) are licensed by the Guernsey Financial Services Commission. Registered Office: NTGL/NTFSGL -Trafalgar Court, Les Banques, St Peter Port, Guernsey GY1 3DA. NTIFASGL - Trafalgar Court, Les Banques, St Peter Port, Guernsey GY1 3QL. Northern Trust International Fund Administration Services (Ireland) Limited (160579)/Northern Trust Fiduciary Services (Ireland) Limited (161386). Registered Office: Georges Court, 54-62 Townsend Street, Dublin 2, D02 R156, Ireland.