- Who We Serve
- What We Do
- About Us
- Insights & Research
- Who We Serve
- What We Do
- About Us
- Insights & Research
Accounting for Climate Change: Scope 3 Emissions and Their Effective Capture
Investors who want to ensure their risk management in relation to global warming is fit for purpose, must overcome significant challenges to ensure they consider the full range of emission types across portfolios.
KEY POINTS
What it is
Recording Scope 3 emissions is essential for effective monitoring of climate change risk in portfolios but doing so is challenging.
Why it matters
Without accurate Scope 3 data, investors are likely to struggle to achieve a complete assessment of climate risk across their portfolios.
Where it's going
More comprehensive analysis of Scope 3 emissions data offers investors significant potential for improving risk management.
As investors come under increasing pressure to take greenhouse gas emissions and climate change risks into account as part of their portfolio construction, one of the more challenging hurdles to doing so is accurately assessing Scope 3 emissions.
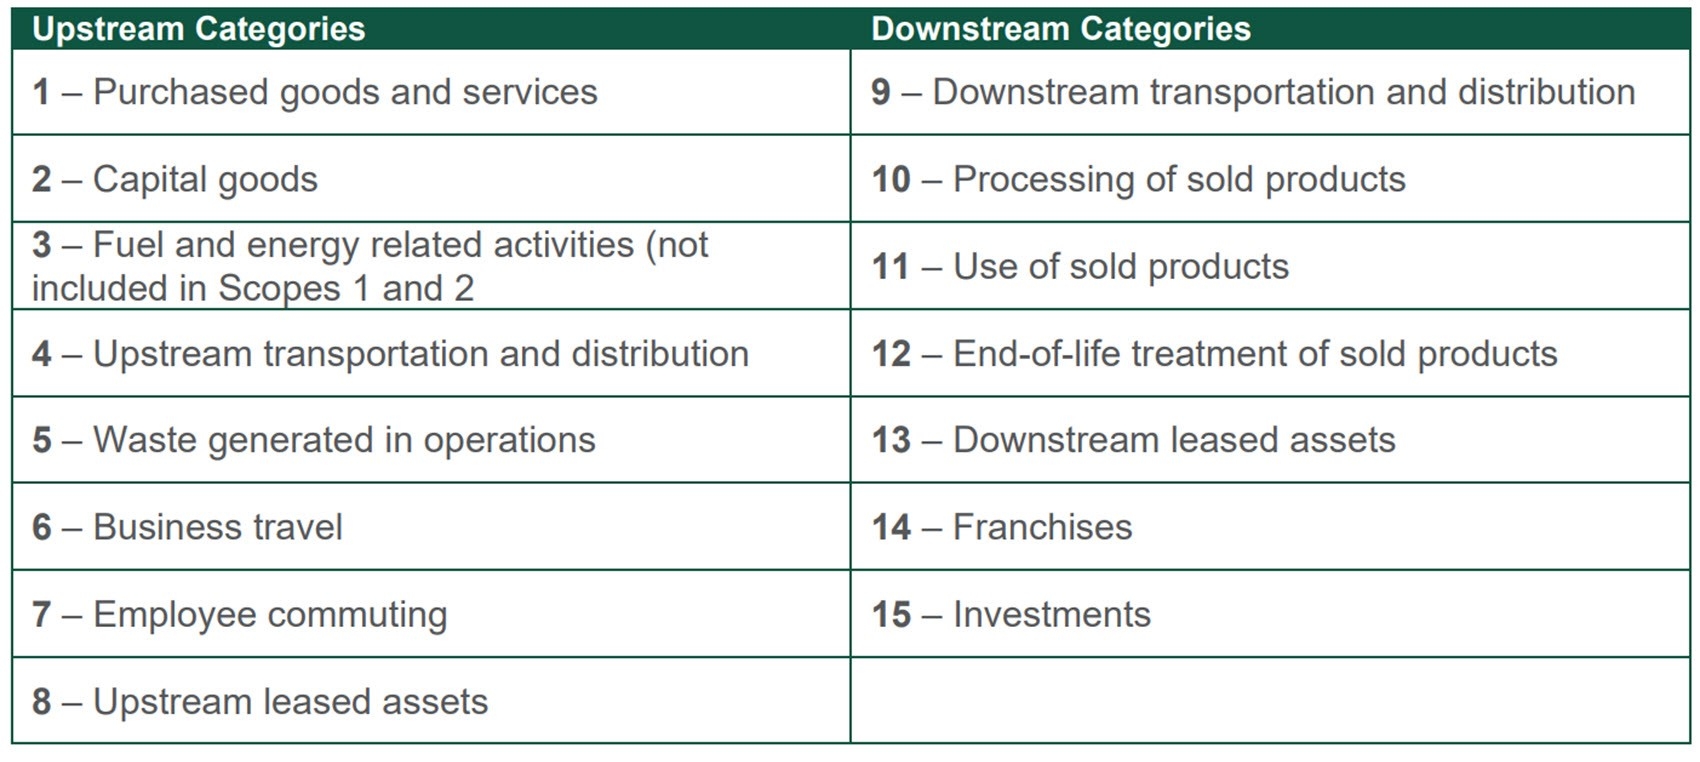
These include all emissions arising from across a business’ value chain. This is a diverse and far-reaching category, in stark contrast to the emissions captured by Scope 1 and Scope 2 which cover, respectively, those produced directly by a company and those created through the purchase of electricity and heating.
The classification process is more than just an intellectual exercise; it is vital for effective decarbonization. A portfolio that focused exclusively on Scope 1 and 2 emissions, for example, would potentially and significantly underestimate exposure to climate risks.
However, unlike Scope 1 and 2 emissions, the scale and variety of Scope 3 emissions has made it difficult to monitor and tabulate them accurately.
This presents a problem for investors looking to mitigate climate risk, especially as Scope 3 emissions often account for the largest share of a company’s carbon footprint.
Sector breakdown
Indeed, within the investible universe, there are certain sectors that produce significantly greater Scope 3 emissions than others.
Companies operating in oil and gas production, diversified mining, steel, automobiles, and other industrials are more likely to be responsible for significant Scope 3 emissions in absolute terms.
And there are several sectors whose Scope 3 emissions are likely to be far higher than the emissions they record relative to what they rack up under Scope 1 or 2. For example, emissions under Scope 3 for the financial sector, which include the emissions of listed equity and corporate bonds, mortgage lending and sovereign debt, far exceed the emissions the sector produces directly.
It is a similar picture in sectors such as real estate, IT, and healthcare, where the levels of Scope 3 emissions are estimated to be orders of magnitude greater than these sectors’ Scope 1 or 2 emissions.
Despite growing pressure from regulators and policymakers to force increased disclosure, there are good reasons why it remains challenging for investors and companies alike to assess Scope 3 emissions.
Most obviously, data availability is a serious impediment; most emissions lie outside of a company’s direct control and often require estimates from a supplier or approximations of customer use.
A consumer goods company making electronic goods, for example, must estimate energy efficiency and user habits over the lifetime of a product. It is likely that assessments involving longer time horizons may be inaccurate given consumer usage trends and habits can be prone to change.
Emissions emanating from supply chains may also be harder to capture as they are frequently comprised of SMEs who may not record their own Scope 1 or 2 emissions.
EXHIBIT 1: SCOPE 3 Categories
Source: Northern Trust Asset Management, Macrobond, U.S. Bureau of Economic Analysis (BEA). Q = quarter; GDP = Gross Domestic Product. Data as of 6/30/2025. Historical trends are not predictive of future results.
Accounting for complexity
In short, for many listed companies, there is much uncertainty and guesswork involved in performing the calculations needed to meet increasingly onerous disclosure requirements. For investors, this lack of accuracy presents an additional layer of difficulty in terms of obtaining consistent information across a portfolio and making informed comparisons between regions, particularly when comparing sectors within emerging and developed markets.
The complexity inherent in compiling Scope 3 data can also lead to under-reporting and an overfocus on information that is easier to record. It has become relatively commonplace for companies to report emissions related to business travel and employee commuting to work, for example, as these are relatively straightforward to calculate, but they may not be the most material contributing factors. More complex categories, such as purchased goods and services or use of sold products, are often omitted from disclosures given the difficulty in producing meaningful data.
Investors also need to understand the risk of double-counting — where the Scope 1 or 2 emissions of one company are the Scope 3 emissions of another company in the same portfolio.
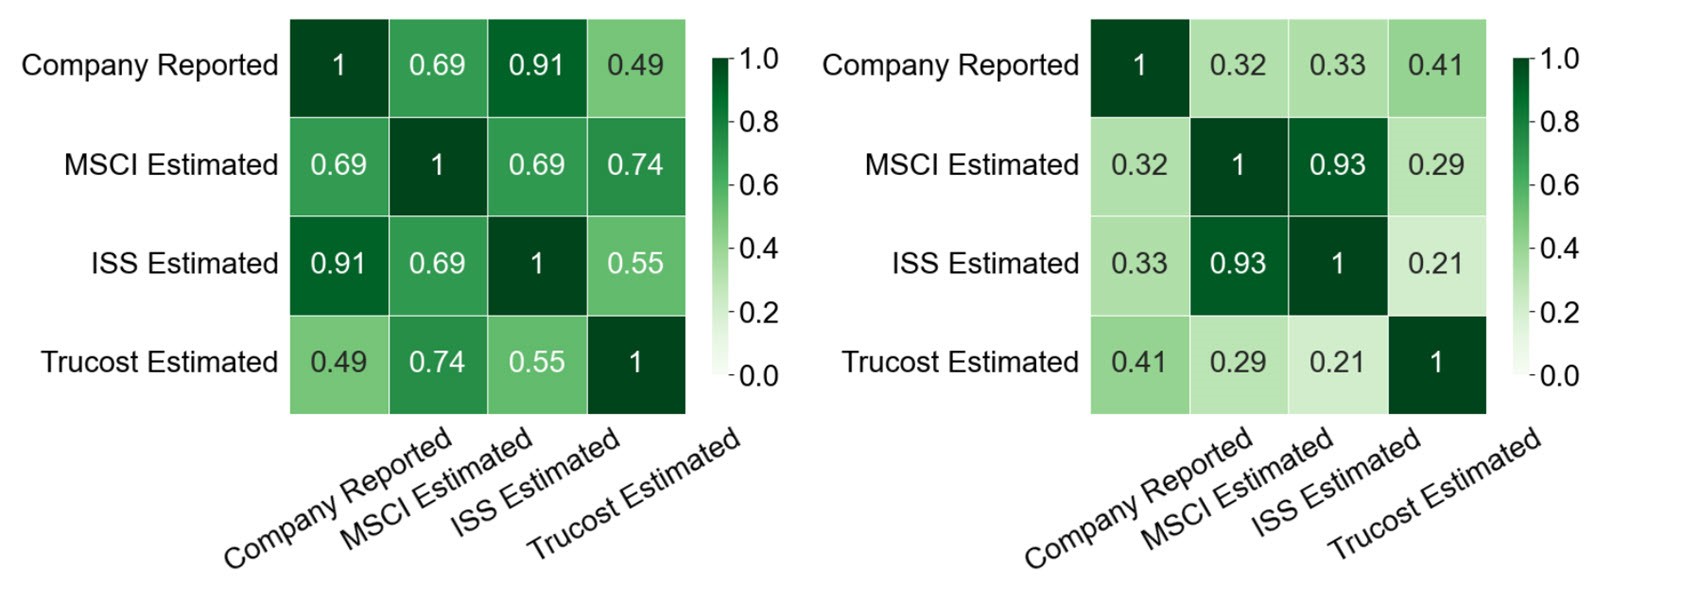
A number of information emissions data providers are trying to overcome these challenges through carefully modeled emission estimates. Each provider has their own framework for compiling data while an additional layer of complexity is added by the competing methodologies they use to estimate Scope 3 emissions when such figures are not made available by the companies in question. These methodologies can vary by model (e.g. top-down versus bottom-up), emissions factor sources or the treatment of missing data. Differences are compounded by a lack of comparability due to different publishing schedules between providers.
EXHIBIT 2: DATA PROVIDER DISCREPANCY
Comparing MSCI, ISS and Truscost Scope 3 emissions estimates, MSCI World Index (left) and MSCI EM Index (right)
Source: Northern Trust Asset Management, Macrobond, U.S. Bureau of Economic Analysis (BEA). Q = quarter; GDP = Gross Domestic Product. Data as of 6/30/2025. Historical trends are not predictive of future results.
Despite these methodological differences, the estimation challenges and the data inconsistencies, the strategic importance of understanding the full emissions profile of portfolio companies should not be underestimated. Scope 3 emissions, particularly, represent a complex but increasingly relevant dimension of climate-aware investing.
Ultimately, deeper analysis of Scope 3 emissions offers the potential to improve risk management, anticipate regulatory shifts, and align more effectively with long-term climate objectives. For many investors, this represents not just a reporting obligation, but an emerging investment lens through which both portfolio risks and opportunities can be more clearly understood.
As regulatory requirements evolve and data quality improves, the integration of Scope 3 data is likely to become more standardized and, consequently, better reported.
That all said, while Scope 3 emissions may be a critical component of understanding a company’s climate impact, they are far from being the only element that matters.
Investors can also benefit from the analysis and measurement of vital metrics such as forward-looking indicators, climate targets, and the alignment of company revenues and capital expenditure with a low-carbon future.
Investors have a role to play, too, in improving data accuracy. Through active engagement with the companies they back, shareholders can encourage more robust Scope 3 disclosure as well as supporting tangible efforts to reduce these emissions.
IMPORTANT INFORMATION
Northern Trust Asset Management (NTAM) is composed of Northern Trust Investments, Inc., Northern Trust Global Investments Limited, Northern Trust Fund Managers (Ireland) Limited, Northern Trust Global Investments Japan, K.K., NT Global Advisors, Inc., 50 South Capital Advisors, LLC, Northern Trust Asset Management Australia Pty Ltd, and investment personnel of The Northern Trust Company of Hong Kong Limited and The Northern Trust Company.
Issued in the United Kingdom by Northern Trust Global Investments Limited, issued in the European Economic Association (“EEA”) by Northern Trust Fund Managers (Ireland) Limited, issued in Australia by Northern Trust Asset Management (Australia) Limited (ACN 648 476 019) which holds an Australian Financial Services Licence (License Number: 529895) and is regulated by the Australian Securities and Investments Commission (ASIC), and issued in Hong Kong by The Northern Trust Company of Hong Kong Limited which is regulated by the Hong Kong Securities and Futures Commission.
For Asia-Pacific (APAC) and Europe, Middle East and Africa (EMEA) markets, this information is directed to institutional, professional and wholesale clients or investors only and should not be relied upon by retail clients or investors. This information may not be edited, altered, revised, paraphrased, or otherwise modified without the prior written permission of NTAM. The information is not intended for distribution or use by any person in any jurisdiction where such distribution would be contrary to local law or regulation. NTAM may have positions in and may effect transactions in the markets, contracts and related investments different than described in this information. This information is obtained from sources believed to be reliable, its accuracy and completeness are not guaranteed, and is subject to change. Information does not constitute a recommendation of any investment strategy, is not intended as investment advice and does not take into account all the circumstances of each investor.
This report is provided for informational purposes only and is not intended to be, and should not be construed as, an offer, solicitation or recommendation with respect to any transaction and should not be treated as legal advice, investment advice or tax advice. Recipients should not rely upon this information as a substitute for obtaining specific legal or tax advice from their own professional legal or tax advisors. References to specific securities and their issuers are for illustrative purposes only and are not intended and should not be interpreted as recommendations to purchase or sell such securities. Indices and trademarks are the property of their respective owners. Information is subject to change based on market or other conditions.
All securities investing and trading activities risk the loss of capital. Each portfolio is subject to substantial risks including market risks, strategy risks, advisor risk, and risks with respect to its investment in other structures. There can be no assurance that any portfolio investment objectives will be achieved, or that any investment will achieve profits or avoid incurring substantial losses. No investment strategy or risk management technique can guarantee returns or eliminate risk in any market environment. Risk controls and models do not promise any level of performance or guarantee against loss of principal. Any discussion of risk management is intended to describe NTAM’s efforts to monitor and manage risk but does not imply low risk.
Past performance is not a guarantee of future results. Performance returns and the principal value of an investment will fluctuate. Performance returns contained herein are subject to revision by NTAM. Comparative indices shown are provided as an indication of the performance of a particular segment of the capital markets and/or alternative strategies in general. Index performance returns do not reflect any management fees, transaction costs or expenses. It is not possible to invest directly in any index. Net performance returns are reduced by investment management fees and other expenses relating to the management of the account. Gross performance returns contained herein include reinvestment of dividends and other earnings, transaction costs, and all fees and expenses other than investment management fees, unless indicated otherwise. For U.S. NTI prospects or clients, please refer to Part 2a of the Form ADV or consult an NTI representative for additional information on fees.
Forward-looking statements and assumptions are NTAM’s current estimates or expectations of future events or future results based upon proprietary research and should not be construed as an estimate or promise of results that a portfolio may achieve. Actual results could differ materially from the results indicated by this information.
Not FDIC insured | May lose value | No bank guarantee