- Who We Serve
- What We Do
- About Us
- Insights & Research
- Who We Serve
- What We Do
- About Us
- Insights & Research
Dissecting Recent Market Activity
With the recent US Equity sell-off, I wanted to examine some of the drivers and historical trends that are not as widely discussed behind recent market action.
First, let’s put the current sell-off in historical perspective. Sell-offs are common: they happen almost every year. In fact, in an analysis conducted by the Carson Group, the S&P 500 Index has averaged a 14% correction each year going back to 1980. Given the incredible US large cap bull market the past two years, it is easy to forget both years experienced 8%+ corrections, most recently in July/August 2024.
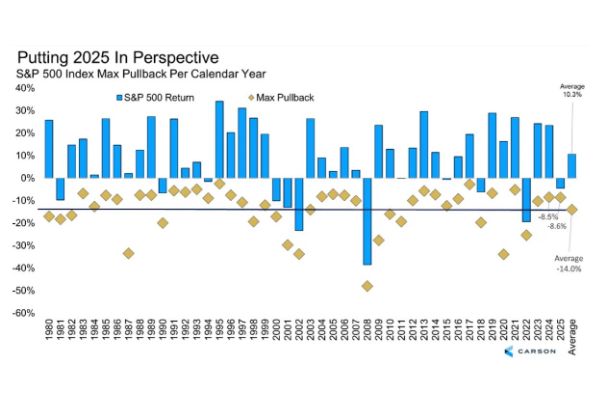
Source: Carson, YCharts 3/11/2025 (1980-Current)
There’s even an argument to be made for seasonality here. In years following 20%+ returns, the below analysis discovered that the S&P 500 Index tends to consolidate around March, with an average trough March 12. I caution against applying this historical pattern over the rest of the year, as the drivers for today’s selling are unique to say the least. However it is encouraging that action today is certainly not unprecedented and, in fact, may fall more in line with historical trends than we realize.
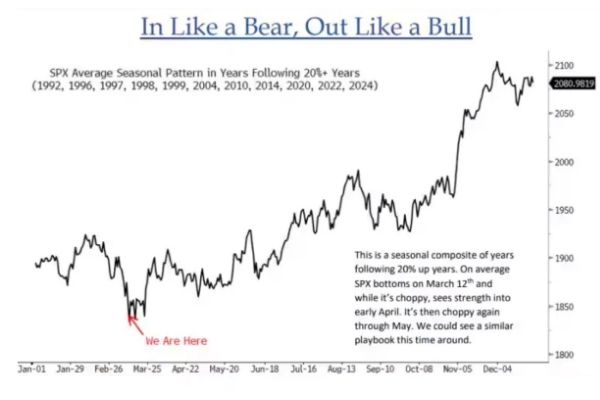
Source: Bloomberg Finance
Up to this point, the US equity sell-off has been entirely due to a growth scare – the fear that economic growth will decline as a result of tariffs and deteriorating geopolitical relations. These fears are manifested in the rapidly falling P/E ratio on the S&P 500. In fact, multiples have not fallen this rapidly at any time since the onset of the Covid pandemic. The key takeaway is that prices are lower because the price-to-earnings multiple which investors are willing to pay has fallen. Analysts are still expecting robust earnings growth throughout the remainder of the year, and price action does not (yet) reflect weaker earnings, only the fear of a potential lapse in growth. Much attention must be paid to near-term corporate guidance to assess the validity of this scare.
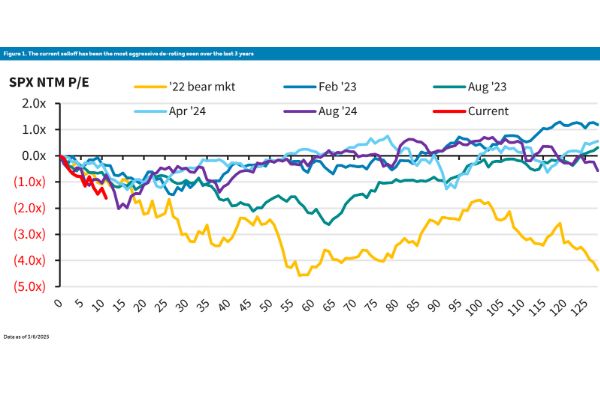
Source: Bloomberg, Barclays Research
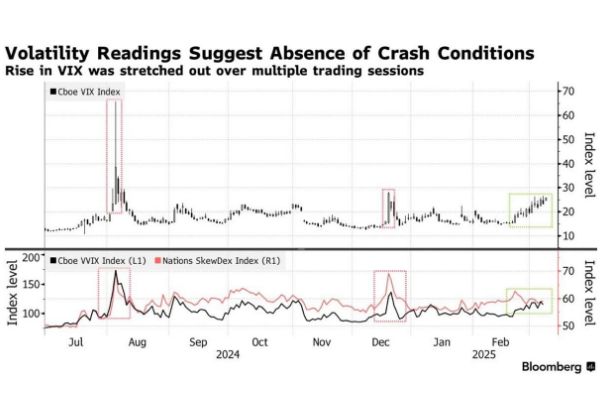
VIX has risen to the mid-20’s. As a reminder, VIX represents how investors anticipate volatility based upon options pricing, with an increase in VIX indicating that investors expect higher volatility (and therefore more risk). When VIX is in the range we find it today, forward returns are weak historically. A historical analysis by Duality Research found that forward S&P 500 returns were the worst when VIX was in a range between 20 and 30. This VIX range is commonly associated with elevated (but not extreme) fear of expected volatility. And similar to today's sentiment, many investors are cautious at present, but not yet stampeding for the exits, which fits with VIX around the mid-20’s. Forward returns are highest when VIX is low (under 20) or very high (over 30).
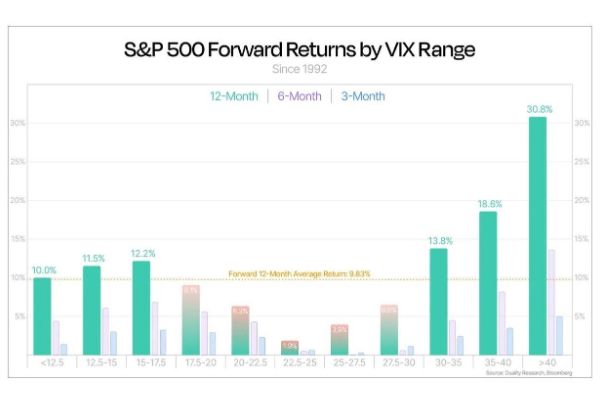
Source: Duality Research, Bloomberg
One fascinating observation is how steady VIX has risen over the past two weeks going back to late February. In a panic or mass exodus from risk assets, VIX tends to pop higher in a very short period of time. For example, in the two week period leading up to the Covid outbreak in the US, VIX rose from 17 to 50. To hammer the point, on March 6 2020, VIX jumped from 34 to 49 in a single trading day. Over the past two weeks, we have witnessed a far more gradual and modest increase, from around 15 to 26, almost appearing like stair steps. This market pattern suggests that investors are not uniform in their short-term outlook and the sell-off is not a panic, at least thus far.
Source: Bloomberg
Credit spreads are also holding tight. Declining and low corporate bond spreads indicate a lower risk environment and are prevalent in equity bull markets, and that pattern has certainly been the case during the recent bull run. While spreads have widened a little in recent weeks, they remain very low historically, a sign that the bond market does not have quite the same fear as has been expressed in the US equity market. One note is how much EM credit spreads have widened in recent weeks, a trend for which I do not have an explanation at present.
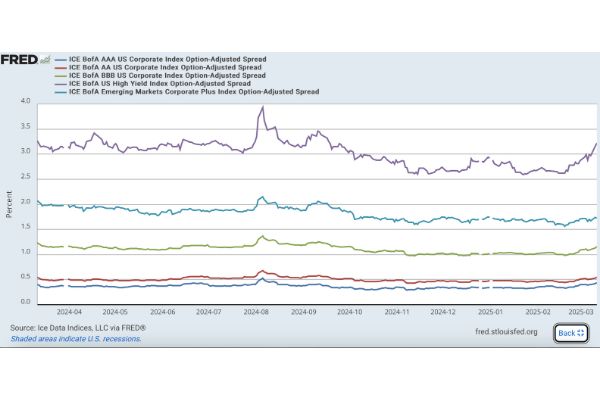
Source: Ice Data Indices, LLC via FRED
Market rotation continues. The biggest concern I have from examining recent market rotation is the pivot between Consumer Staples and Cyclicals. The last few weeks have witnessed a rapid pivot between these two sectors. In prior instances, S&P 500 returns were rather lackluster. The below graphic from Sentiment Trader details out the returns in the 16 prior instances where the Consumer Staples sector snapped back in relative performance to Consumer Discretionary. On average, overall S&P 500 returns were negative 2.5% in the following 12 months after such a risk-off rotation. Note that rotation between cyclicals and staples has not historically been associated with massive declines in equity prices (such as GFC or Covid crashes).
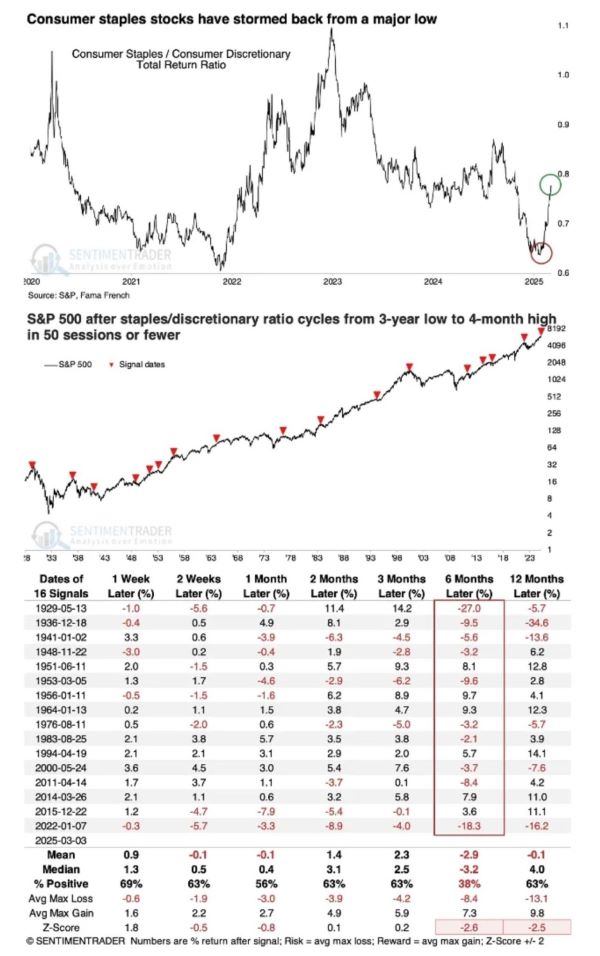
Market rotation is perhaps the biggest story in global equity markets. What worked the past two plus years has not been working as well in 2025.
Meet Your Expert
Grant Johnsey
Grant is responsible for delivering capital market solutions to institutional clients across agency brokerage, transition management, security finance, and foreign exchange.

Northern Trust Securities, Inc.(NTSI), Member FINRA, SIPC and a subsidiary of Northern Trust Corporation. Products and services offered through NTSI are not FDIC insured, not guaranteed by any bank, and are subject to investment risk including loss of principal amount invested. Additional disclosures are included in the link, see http://www.northerntrust.com/ntsidisclosure
Business Continuity Notice- Northern Trust Securities, Inc.
© 2025 Northern Trust Corporation. Head Office: 50 South La Salle Street, Chicago, Illinois 60603 U.S.A. Incorporated with limited liability as an Illinois corporation under number 0014019. Products and services provided by subsidiaries of Northern Trust Corporation may vary in different markets and are offered in accordance with local regulation. This material is directed to professional clients (or equivalent) only and is not intended for retail clients and should not be relied upon by any other persons. This information is provided for informational purposes only and does not constitute marketing material. The contents of this communication should not be construed as a recommendation, solicitation or offer to buy, sell or procure any securities or related financial products or to enter into an investment, service or product agreement in any jurisdiction in which such solicitation is unlawful or to any person to whom it is unlawful. This communication does not constitute investment advice, does not constitute a personal recommendation and has been prepared without regard to the individual financial circumstances, needs or objectives of persons who receive it. Moreover, it neither constitutes an offer to enter into an investment, service or product agreement with the recipient of this document nor the invitation to respond to it by making an offer to enter into an investment, service or product agreement. For Asia-Pacific markets, this communication is directed to expert, institutional, professional and wholesale clients or investors only and should not be relied upon by retail clients or investors. For legal and regulatory information about our offices and legal entities, visit northerntrust.com/disclosures. The views, thoughts, and opinions expressed in the text belong solely to the author, and not necessarily to the author's employer, organization, committee or other group or individual.
The following information is provided to comply with local disclosure requirements: The Northern Trust Company, London Branch, Northern Trust Global Investments Limited, Northern Trust Securities LLP, Northern Trust Global Services SE UK Branch and Northern Trust Investor Services Limited, 50 Bank Street, London E14 5NT, are authorised and regulated by the UK’s Financial Conduct Authority. The Northern Trust Company, London Branch and Northern Trust Global Services SE UK Branch are also authorised and regulated by the UK’s Prudential Regulation Authority. Not all of the products and services mentioned within this material are authorised and regulated by the UK’s Financial Conduct Authority or UK’s Prudential Regulation Authority. Northern Trust Global Services SE, 10 rue du Château d’Eau, L-3364 Leudelange, Grand-Duché de Luxembourg, incorporated with limited liability in Luxembourg at the RCS under number B232281; authorised by the ECB and subject to the prudential supervision of the ECB and the CSSF; Northern Trust Global Services SE UK Branch, UK establishment number BR023423 and UK office at 50 Bank Street, London E14 5NT; Northern Trust Global Services SE Sweden Bankfilial, Ingmar Bergmans gata 4, 1st Floor, 114 34 Stockholm, Sweden, registered with the Swedish Companies Registration Office (Sw. Bolagsverket) with registration number 516405-3786 and the Swedish Financial Supervisory Authority (Sw. Finansinspektionen) with institution number 11654; Northern Trust Global Services SE Netherlands Branch, Viñoly 7th floor, Claude Debussylaan 18 A, 1082 MD Amsterdam; Northern Trust Global Services SE Abu Dhabi Branch, registration Number 000000519 licenced by ADGM under FSRA #160018; Northern Trust Global Services SE Norway Branch, org. no. 925 952 567 (Foretaksregisteret), address Third Floor, Haakon VIIs gate 6 0161 Oslo, is a Norwegian branch of Northern Trust Global Services SE supervised by Finanstilsynet. Northern Trust Global Services SE Leudelange, Luxembourg, Zweigniederlassung Basel is a branch of Northern Trust Global Services SE. The Branch has its registered office at Grosspeter Tower, Grosspeteranlage 29, 4052 Basel, Switzerland, and is authorised and regulated by the Swiss Financial Market Supervisory Authority FINMA. The Northern Trust Company Saudi Arabia, PO Box 7508, Level 20, Kingdom Tower, Al Urubah Road, Olaya District, Riyadh, Kingdom of Saudi Arabia 11214-9597, a Saudi Joint Stock Company – capital 52 million SAR. Regulated and Authorised by the Capital Market Authority License #12163-26 CR 1010366439. Northern Trust (Guernsey) Limited (2651) (NTGL)/Northern Trust Fiduciary Services (Guernsey) Limited (29806) (NTFSGL)/Northern Trust International Fund Administration Services (Guernsey) Limited (15532) (NTIFASGL) are licensed by the Guernsey Financial Services Commission. Registered Office: NTGL/NTFSGL -Trafalgar Court, Les Banques, St Peter Port, Guernsey GY1 3DA. NTIFASGL - Trafalgar Court, Les Banques, St Peter Port, Guernsey GY1 3QL. Northern Trust International Fund Administration Services (Ireland) Limited (160579)/Northern Trust Fiduciary Services (Ireland) Limited (161386). Registered Office: Georges Court, 54-62 Townsend Street, Dublin 2, D02 R156, Ireland.