- Who We Serve
- What We Do
- About Us
- Insights & Research
- Who We Serve
- What We Do
- About Us
- Insights & Research
Mixed Signals: Get ready for February 13
By: Grant Johnsey, Head of Client Solutions, Capital Markets, Americas
The stock market performance on Friday was quite unusual. The S&P 500 closed 1.1% higher on the day, with Meta leading the way. After a superb earnings report and special dividend announcement, Meta added $197 billion in market cap on Friday, which is the biggest single-day jump ever in market value according to Bloomberg. Yet despite good news from Meta (and Amazon's strong earnings too), more than half of the stocks in the large cap index fell. Since 1990, there have been only 12 days when most stocks fell but the market gained 1% or more.
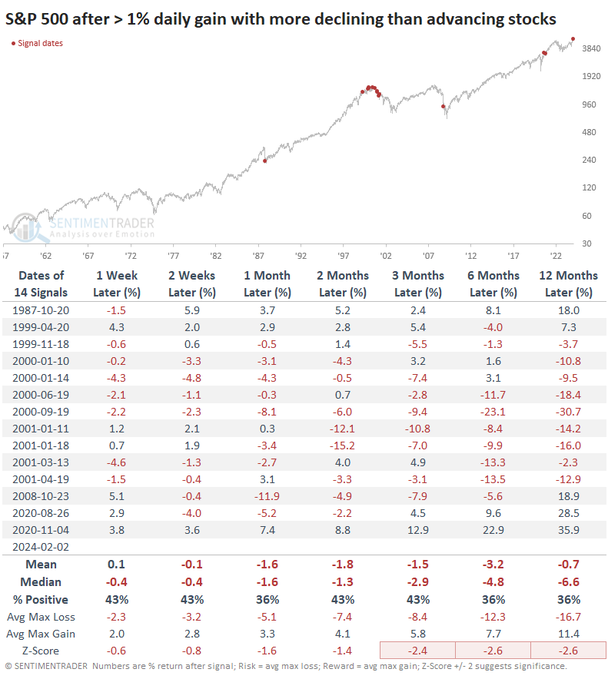
Caption: Days of 1%+ gains with less than less than 50% of stocks declining
Friday's stock market highlighted a challenge unique to today's investment environment: how to interpret mixed signals. And there are quite a few mixed signals to consider.
LC versus SC: The Russell 2000 Index of small cap stocks actually lost 0.6% on Friday. The S&P 500 continues in a strong bull market, whereas the Russell 2000 index is still mired in a long bear market. The large cap cycle of outperformance, now in its 15th year, is rather long historically. Typically as inflation slows and as the economy expands, small caps tend to perform better, but we are not seeing that today.
Market breadth: Good market breadth, defined as a period when most stocks in an index are participating in a rally, is an indicator of the sustainability of a stock market rally. Only 25% of stocks in the S&P 500 are outperforming the index, which is the lowest percentage since the waning days of the tech bubble in 2000. Yet around two-thirds of these large cap stocks have 50 day averages above their 200 day average, which is the strongest level in over 2 years.
US Labor Data: The US non-farm payroll data released last week surprised to the upside, with 353k jobs created in January compared to the survey of 185k. Moreover prior job reports have been revised upwards for the past two months, ending a trend of downward revisions in much of 2023. However the monthly household survey, also conducted by BLS, showed a decline in jobs for the second consecutive month, thus deviating from the official jobs report. And average weekly hours worked dropped to the lowest levels since the onset of the pandemic in 2020. The U-6 unemployment rate increased slightly to 7.2%, indicating increased underemployment or struggles for part-time workers finding a full-time position.
China: Despite persistent negative news, investors continued to pour loads of money into the Chinese equity market for the 4th consecutive week, setting records in the process. Over the past four weeks, flows into Chinese equities have exceeded $21 billion, the largest ever inflow over a 4-week period. Yet the Chinese equity market has traded lower over this time period, with the CSI 300 Index reaching a 5 year low.
Mag7: Even the engines behind strong US stock market performance, the mega-cap tech stocks that represent the Magnificent 7, are sending mixed signals. Tesla and Google have struggled with earnings and their stocks have been punished. Compared to Meta's incredible Friday, Alphabet--the parent company of Google--saw over $140 billion in market cap erode in a single day after disappointing ad revenue results were announced last week.
Inflation: And that brings us to inflation. The market seems to betting on continued disinflationary trends. Jerome Powell, interviewed on 60 minutes on Sunday, stated "our confidence is rising (that inflation is moving sustainably to 2%)". Truflation, a real-time CPI, calculates that the US inflation rate is only 1.4% today, suggesting that perhaps we may already be below the FOMC's inflation target. However, the January PMI report showed that input prices are rising amid a pick-up in manufacturing activity. The recent Global PMI Commodities Price report also showed prices rose in January, albeit it slightly, for the first time in almost a year. US Average Hourly earnings also jumped in January, rising 0.6% month/over/month which was twice the survey estimate.
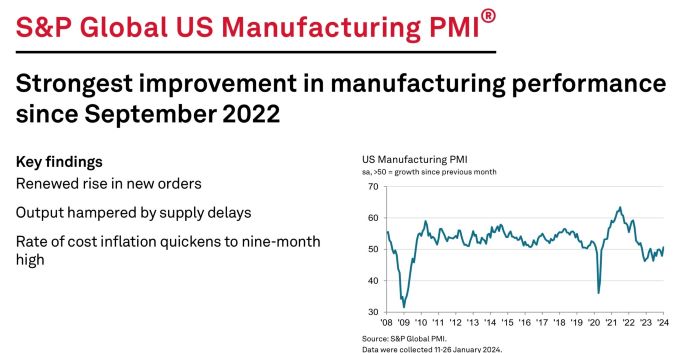
Source: S&P Global US Manufacturing report: February 1, 2024
Disinflationary Growth? Or return of Inflation?: If inflation continues to moderate, and recent economic strength in the US continues (see Atlanta Fed's GDPNow forecast of 4.2% 1Q24 GDP growth), strong stock market performance will likely continue. The stock (and bond) market loves a disinflationary boom. However, surprise in inflation data, in the January report due out next week or in future reports, could jolt the market. As investors saw in 2022, inflationary growth may not be rewarded, especially when inflation is unexpected.
For this reason, the upcoming January CPI report, which is due out at 8:30am ET on February 13th, will be closely watched. I encourage investors to be prepared. Inflation data inline or lower than market expectations will be positive news for the markets. A report showing continued moderating inflation could help extend the market rally, benefitting both stocks and bonds. However any surprises to the upside could unhinge the market's recent strong performance.
Increased Volatility is Likely: In the rare instances when the S&P 500 Index rises by 1% in a day despite most stocks falling, stock market volatility tended to pick up in the months that followed. Sometimes volatility after usual days such as this past Friday is positive: stock returns were fantastic in late 2020 into 2021 after two such days in the second half of 2020. But a string of these up days when most stocks were down twenty years earlier in 2000 and 2001 was a prelude to the tech bubble sell off. The anomaly of a positive market day enjoyed by few is volatility signal.
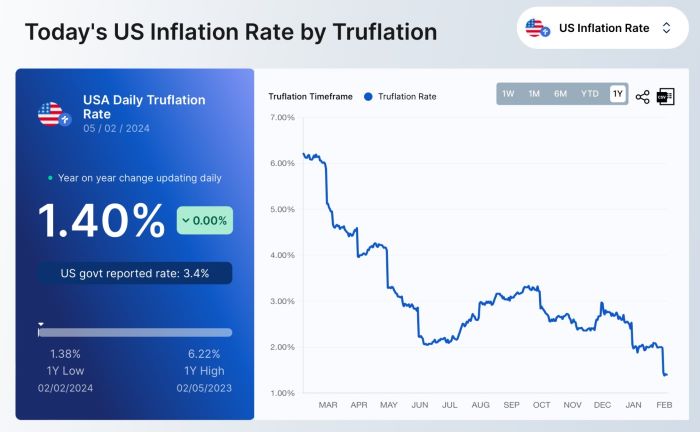
Caption: Truflation real-time CPI as reported on February 5, 2024
As for what to expect on the February 13th CPI report, consider Truflation's current inflation estimate, which sits at 1.4%. Thus far, the BLS CPI has followed the direction of Truflation's real-time CPI consistently, from rising inflation post-pandemic to falling inflation over the past year. With the Truflation CPI falling through January and sitting well below the market's forecast, I would expect the BLS CPI to follow suit. While the FOMC will still have to deal with secular inflationary trends like on-shoring costs and a tight labor market over the longer run, the mostly likely outcome is a January CPI report that supports continued moderation in inflation, which would be good news for markets.
Meet Your Expert
Grant Johnsey
Grant is responsible for delivering capital market solutions to institutional clients across agency brokerage, transition management, security finance, and foreign exchange.

Northern Trust Securities, Inc.(NTSI), Member FINRA, SIPC and a subsidiary of Northern Trust Corporation. Products and services offered through NTSI are not FDIC insured, not guaranteed by any bank, and are subject to investment risk including loss of principal amount invested. Additional disclosures are included in the link, see http://www.northerntrust.com/ntsidisclosure
Business Continuity Notice- Northern Trust Securities, Inc.