Government Shutdown and Labor Market Risks
How U.S. equities historically have reacted to government shutdowns, and what may happen this time.
KEY POINTS
What it is
We analyze what has occurred in past shutdowns, and what investors should look for if a shutdown occurs next week.
Why it matters
A potential U.S. government shutdown poses risks to the labor market.
Where it's going
Historically, the drag from shutdowns has tended to be short-lived.
September 25, 2025
The U.S. faces a likely government shutdown on October 1, with prediction markets assigning a 65% chance. Both parties remain entrenched, showing little interest in a continuing resolution. A temporary shutdown appears to be a reasonable base case.
Shutdowns are a recurring feature of U.S. politics, with 20 funding gaps since 1976 — only four lasting more than a day. The longest was 35 days in 2018–2019; others averaged 14 days. If a shutdown occurs on October 1, it will likely be a full one, affecting all discretionary agencies, similar to the 16-day shutdown in 2013.
EXHIBIT 1: S&P INDEX RETURNS SURROUNDING MULTI-DAY GOVERNMENT SHUTDOWNS (%)
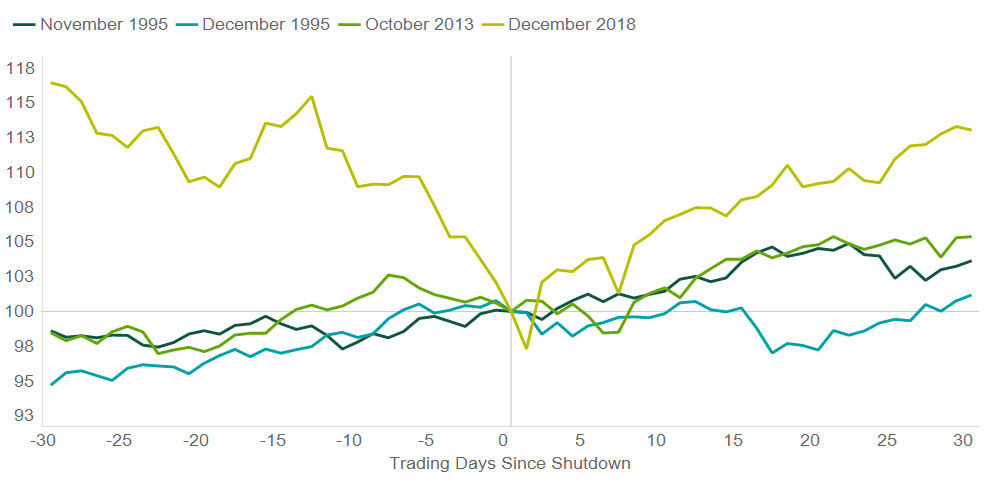
Northern Trust Asset Management, Macrobond, S&P Global. Data through 12/31/2024. Past performance is not a guarantee of future results. Index performance returns do not reflect any management fees, transaction costs or expenses. It is not possible to invest directly in any index. The S&P 500 Index represents large-cap U.S. equities.
Markets have demonstrated a remarkable ability to adapt and recover from these disruptions over the years. At most, shutdowns have led to only small and temporary softness in U.S. equities. In all four of the prior multi-day shutdowns, U.S. equities were higher 30 days following the start of the shutdown. Some risk can be priced in ahead of time, as investors anticipate the possibility of some policy disruption. For example, in the month leading up to the 2018 shutdown, U.S. equities lost over 15%. However, the environment leading up to that episode was much different than today. There were other market influences at play, including Federal Reserve rate hikes.
From an economic perspective, the overall drag from shutdowns has also tended to be short-lived. Discretionary spending represents around 30% of federal spending. Core entitlement programs that represent the bulk of federal spending remain unaffected, helping to limit the direct economic impact for most Americans. Most impacts from furloughed government workers usually reverse once the government reopens. Businesses and local economies that rely on federal contracts can also experience some turbulence.
The current situation poses labor market risks due to Office of Budget and Management directives urging agencies to consider RIFs (reduction in force) where funding may lapse. Permanent layoffs on par with furloughs in previous shutdowns would likely have a sizeable economic impact. While mass layoffs are a concern, it’s unclear if the threat is a negotiation tactic. Key details — such as the number of affected employees and legal feasibility — remain uncertain. We also note parallels to DOGE actions earlier this year, through which we haven’t seen major disruptions materialize yet. Lastly, the size of the government workforce has been declining for most of this year. We should expect this to continue to trend toward 2022 levels. Today, federal jobs as a share of total employment sit under 2%. Smaller, dispersed layoffs may be manageable, though still unhelpful in a weak labor market.
EXHIBIT 2: CIVILIAN FEDERAL JOBS EXCLUDING POSTAL WORKERS (1,000S)
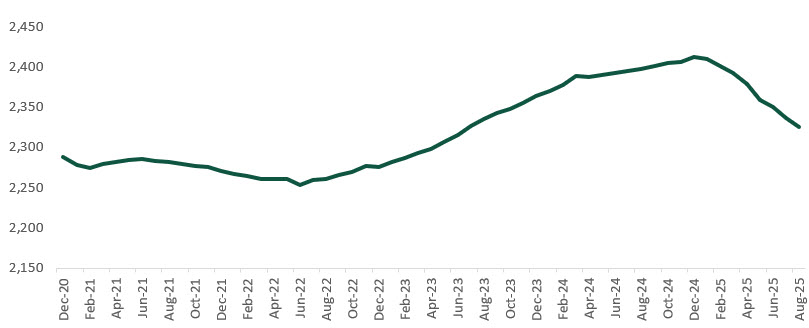
Source: Northern Trust Asset Management, Bloomberg, from December 2020 to August 2025.
A key challenge for investors and the Fed is the possible delay of vital data releases like September jobs and inflation reports. This hampers the Fed’s data-driven approach, though shutdown-related growth and labor risks may reinforce expectations for an October rate cut. Fortunately, markets have also improved in using alternative data sources to navigate traditional data gaps.
Political uncertainty remains, but history suggests a compromise will likely restore stability and support a rebound in economic and market sentiment. While headlines may drive short-term volatility, long-term investors focused on fundamentals have typically been rewarded. As negotiations unfold, we’ll continue monitoring developments around potential agreements, labor market risks, and policy changes.
Meet Your Expert
Peter Wilke
Senior Vice President – Head of Tactical Asset Allocation
As the head of tactical asset allocation (TAA) at Northern Trust Asset Management, Peter is responsible for the research and development of innovative investment strategies for the firm’s TAA initiatives. Previously, Peter worked at Wellington Management, where he was the team leader of the multi-asset income investment boutique in Boston. His group was responsible for developing and managing multi-asset portfolios.

IMPORTANT INFORMATION
This content may not be edited, altered, revised, paraphrased, or otherwise modified without the prior written permission of Northern Trust Asset Management (NTAM). The information contained herein is intended for use with current or prospective clients of Northern Trust Investments, Inc (NTI) or its affiliates. The information is not intended for distribution or use by any person in any jurisdiction where such distribution would be contrary to local law or regulation. NTAM and its affiliates may have positions in and may effect transactions in the markets, contracts and related investments different than described in this information. This information is obtained from sources believed to be reliable, its accuracy and completeness are not guaranteed, and is subject to change. Information does not constitute a recommendation of any investment strategy, is not intended as investment advice and does not take into account all the circumstances of each investor.
This report is provided for informational purposes only and is not intended to be, and should not be construed as, an offer, solicitation or recommendation with respect to any transaction and should not be treated as legal advice, investment advice or tax advice. Recipients should not rely upon this information as a substitute for obtaining specific legal or tax advice from their own professional legal or tax advisors. References to specific securities and their issuers are for illustrative purposes only and are not intended and should not be interpreted as recommendations to purchase or sell such securities. Indices and trademarks are the property of their respective owners. Information is subject to change based on market or other conditions.
All securities investing and trading activities risk the loss of capital. Each portfolio is subject to substantial risks including market risks, strategy risks, advisor risk, and risks with respect to its investment in other structures. There can be no assurance that any portfolio investment objectives will be achieved, or that any investment will achieve profits or avoid incurring substantial losses. No investment strategy or risk management technique can guarantee returns or eliminate risk in any market environment. Risk controls and models do not promise any level of performance or guarantee against loss of principal. Any discussion of risk management is intended to describe NTAM’s efforts to monitor and manage risk but does not imply low risk.
Forward-looking statements and assumptions are NTAM’s current estimates or expectations of future events or future results based upon proprietary research and should not be construed as an estimate or promise of results that a portfolio may achieve. Actual results could differ materially from the results indicated by this information.
Northern Trust Asset Management is composed of Northern Trust Investments, Inc. Northern Trust Global Investments Limited, Northern Trust Fund Managers (Ireland) Limited, Northern Trust Global Investments Japan, K.K, NT Global Advisors, Inc., 50 South Capital Advisors, LLC, Northern Trust Asset Management Australia Pty Ltd, and investment personnel of The Northern Trust Company of Hong Kong Limited and The Northern Trust Company.
Issued in the United Kingdom by Northern Trust Global Investments Limited, issued in the European Economic Association (“EEA”) by Northern Trust Fund Managers (Ireland) Limited, issued in Australia by Northern Trust Asset Management (Australia) Limited (ACN 648 476 019) which holds an Australian Financial Services Licence (License Number: 529895) and is regulated by the Australian Securities and Investments Commission (ASIC), and issued in Hong Kong by The Northern Trust Company of Hong Kong Limited which is regulated by the Hong Kong Securities and Futures Commission.
For Canada, Asia-Pacific (APAC) and Europe, Middle East and Africa (EMEA) markets, this information is directed to institutional, professional and wholesale clients or investors only and should not be relied upon by retail clients or investors. For U.S. NTAM, the information contained herein is intended for use with all current or prospective clients of Northern Trust Investments, Inc (NTI).
NOT FDIC INSURED | MAY LOSE VALUE | NO BANK GUARANTEE
© 2025 Northern Trust Corporation. Head Office: 50 South La Salle Street, Chicago, Illinois 60603 U.S.A.