Markets on the Front Foot: Are Expectations Outpacing Reality?
Investor enthusiasm builds, but conflicting forecasts and fragile labor data suggest the rally may be premature.
KEY POINTS
What it is
Investors are increasingly confident that the U.S. Federal Reserve will cut interest rates several times through mid-2026, signaling a more aggressive easing cycle.
Why it matters
The Fed’s own staff projections suggest a slower, more cautious approach to policy changes — creating a gap between market expectations and official guidance.
Where it's going
This disconnect is shaping market sentiment and could lead to volatility across asset classes, especially if incoming data challenges the current optimism. Uncertainty remains high, and staying alert will be key.
The U.S. Federal Reserve’s recent pivot marks a turning point in monetary policy. For much of the past year, rate-setters have been fixated on the twin threats of persistent inflation and the risk of overshooting with policy tightening. But fundamental weakness in the U.S. labor market has now tipped the balance of risk for the Fed’s dual mandate — maximum employment and stable prices — towards the former. Rate cuts, once a distant hope for dovish investors, are now firmly back on the agenda as the Fed attempts to move policy closer to what it believes to be “neutral.”
Chair Powell, ever keen to avoid binding commitments, made clear that the path ahead is not set in stone. The door remains ajar for further cuts, to be debated meeting by meeting, with each data release a potential inflection point. This measured ambiguity is by design: the Fed wishes to remain nimble, but the practical effect will be to keep markets perpetually attuned to the cadence of economic signals, with traders scrutinizing every jobs print and inflation gauge for clues.
Consumers, meanwhile, have proven resilient — except the lowest income cohort, who continue to feel the pinch. Higher tariffs pose a challenge to growth, yet robust spending elsewhere suggests the economy can weather these headwinds through the remainder of the year.
Looking ahead to 2026, a divergence appears between the bond market’s outlook and the Federal Open Market Committee's own projections. Investors are bracing for a more aggressive easing cycle, with several more rate cuts expected through the middle of next year. In contrast, FOMC staff forecasts point to a slower normalization of policy. This gap in expectations will be a key battleground for market sentiment, with implications for asset prices across the spectrum. For now, uncertainty reigns — and vigilance is the order of the day.
— Peter Wilke, CFA – Head of Tactical Asset Allocation, Global Asset Allocation
DIVERGENT EXPECTATIONS
Interest Rates
There are three key things that we are watching in the rates markets:
- FOMC Rate Cut Expectations: Weaker payroll growth has led markets to pull forward and increase expectations for rate cuts this year. Fed Funds Futures now suggest a small chance of a 50bps%bps%,/span> cut in September (up from 25bps) and a ~75% chance of an additional 25bps cut in October (up from 50%).
- Upward Pressure in Repo Markets: Increased repo rate volatility within the Fed’s target range is a natural result of Quantitative Tightening (QT). QT has also significantly reduced participation in the Fed’s Reverse Repo Program, now at multi-year lows. With corporate tax day and quarter-end approaching — both of which typically drain liquidity — we’re monitoring for potential repo market turbulence.
- Long End Roller Coaster: 30-year yields have been volatile. U.S. Treasuries bounced sharply off the key 5% level, U.K. gilts hit multi-decade highs, and French yields rose, widening the spread with German debt. These shifts reflect political and fiscal uncertainty, with term premium at the long end worth watching as 2025 progresses.
— Dan LaRocco, Head of U.S. Liquidity, Global Fixed Income
MORE FED
- The likelihood of a September cut has increased. We’ve been preparing our fixed income portfolios, especially in the front end, accordingly.
- We’re watching for further pressure in repo markets this month.
- Long end yields have been volatile across the globe; we remain neutral duration within fixed income.
Credit Markets
August began with heightened concerns over economic softness following a weaker-than-expected employment report. This triggered early risk-off sentiment — equities declined, credit spreads widened, and Treasury yields rallied. However, sentiment shifted later in the month after Fed Chair Powell signaled the possibility of rate cuts, leading to a tightening in spreads and a flat finish by month-end. Combined with falling Treasury yields, this backdrop supported strong total returns for high yield.
Yields now sit near 40-month lows, underpinned by solid fundamentals. Second quarter earnings were among the strongest in two years for high yield issuers, with Industrials and Services sectors leading in positive guidance, while Consumer, Media, and Chemicals lagged. High yield companies exceeded EBITDA expectations 2.7 times more often than they missed, and forward guidance skewed 1.6 times more positive than negative.
Despite ongoing policy uncertainties, most high yield issuers maintain robust balance sheets, positioning them well for any potential economic slowdown.
— Ben McCubbin and Sau Mui, Co-Heads of High Yield
STRONG EARNINGS
- Earnings in the second quarter were one of the strongest for high yield companies in the past 2 years.
- 2.7 times more high yield companies beat consensus earnings expectations than missed.
- We are tactically equal-weight high yield, but it remains one of our most preferred fixed income assets.
Equities
Markets notched a fourth straight monthly gain in August. U.S. equities rose 2.0%, while developed ex-U.S. led with a 4.4% increase and emerging markets added 1.3%. A weakening dollar — driven by rising expectations for a September Fed rate cut — provided a strong currency tailwind for U.S. investors abroad. Small caps surged 7.1%, outperforming large caps amid easing recession fears and rate optimism. Market breadth improved, with the S&P 500 Equal Weighted Index beating the headline index by over 0.7%. Despite political and trade uncertainty, volatility stayed low, with the VIX hitting a 2025 low. September has defied seasonal weakness so far, with U.S. equities up another 2.1% through September 11.
U.S. fundamentals remain solid, with second quarter earnings beating expectations. Markets responded positively to Fed Chair Powell’s dovish tone at Jackson Hole, and recent labor and inflation data support a widely anticipated September rate cut. This backdrop favors equities and reduces downside risk, prompting us to raise our exposure to U.S. and emerging market equities. We also maintained our overweight in developed ex-U.S. equities.
— Jordan Dekhayser, Head of Equity Client Portfolio Management
ROBUST RETURNS, DOLLAR WEAKNESS
- Markets rose in August under calm, low-volatility conditions, with a weaker dollar boosting international returns.
- Small caps outperformed large caps, driven by growing rate-cut expectations and fading recession fears.
- We increased global equity exposure amid reduced economic downside and strong corporate earnings; we are now overweight all three major regions.
Real Assets
Data centers have benefited from a generational “wave-on-wave” opportunity — first driven by cloud adoption and now accelerated by AI. Hyperscale capital expenditures continue to expand meaningfully, as major technology firms pursue an aggressive buildout of capacity. This sustained investment has provided a foundational layer of stability for the asset class. Looking ahead, emerging AI technologies are expected to drive incremental demand, reinforcing the sector’s long-term growth potential. At the same time, capital inflows remain robust, though investor scrutiny is intensifying — particularly around return on invested capital for these large capex programs.
The pace of data creation continues to exceed available digital storage capacity, supporting a durable growth outlook. On the supply side, data centers remain differentiated from other real asset sectors due to their elevated development costs and extended construction timelines. Lower vacancies are reflective of these supply/demand trends. Despite recent outperformance, the sector must continue to demonstrate resilience and adaptability in order to sustain its leadership amid evolving technological and macroeconomic conditions.
— Jim Hardman, Head of Real Assets, Multi-Manager Solutions
POWERING PROGRESS
- Data centers have benefitted from tenant demand to drive cloud adoption and AI.
- The demand for data centers has outpaced the supply and vacancies have come down.
- We retained our overweight to global listed infrastructure, partially funded by global real estate.
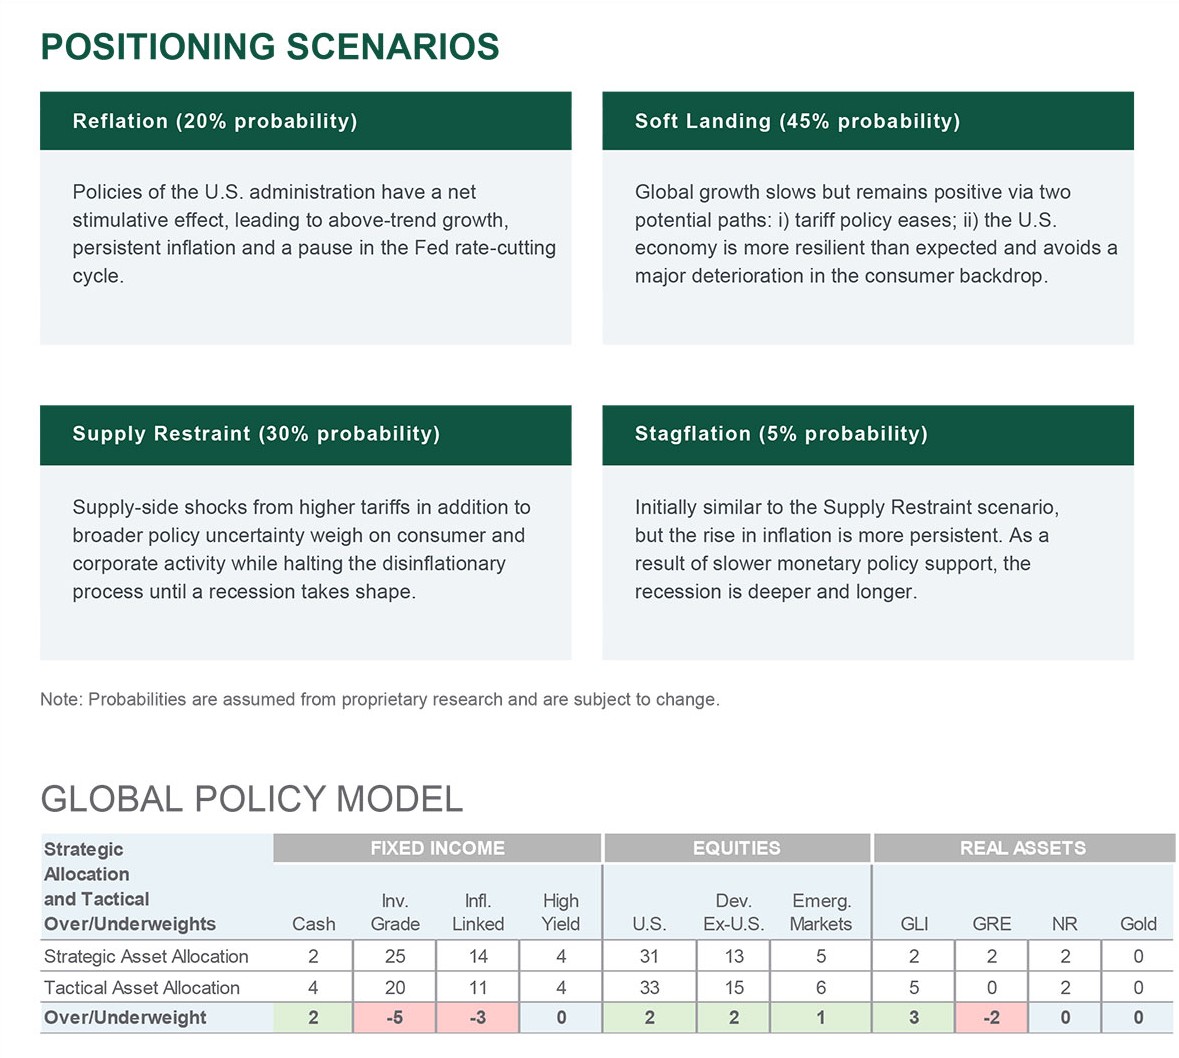
Source: Northern Trust Capital Market Assumptions Working Group, Investment Policy Committee. Strategic allocation is based on capital market return, risk and correlation assumptions developed annually; most recent model released 1/15/2025. The model cannot account for the impact that economic, market and other factors may have on the implementation and ongoing management of an actual investment strategy. Asset allocation does not guarantee a profit or protection against a loss in declining markets. GLI = Global Listed Infrastructure, GRE = Global Real Estate, NR = Natural Resources. Unless otherwise noted, the statements expressed herein are solely opinions of Northern Trust. Northern Trust does not make any representation, assurance, or other promise as to the accuracy, impact, or potential occurrence of any events or outcomes expressed in such opinions.
Meet Your Expert
Peter Wilke
Senior Vice President – Head of Tactical Asset Allocation
As the head of tactical asset allocation (TAA) at Northern Trust Asset Management, Peter is responsible for the research and development of innovative investment strategies for the firm’s TAA initiatives. Previously, Peter worked at Wellington Management, where he was the team leader of the multi-asset income investment boutique in Boston. His group was responsible for developing and managing multi-asset portfolios.

IMPORTANT INFORMATION
Northern Trust Asset Management is composed of Northern Trust Investments, Inc., Northern Trust Global Investments Limited, Northern Trust Fund Managers (Ireland) Limited, Northern Trust Global Investments Japan, K.K., NT Global Advisors, Inc., 50 South Capital Advisors, LLC, Northern Trust Asset Management Australia Pty Ltd, and investment personnel of The Northern Trust Company, The Northern Trust Company (Singapore Branch), and The Northern Trust Company of Hong Kong Limited.
Issued in the United Kingdom by Northern Trust Global Investments Limited, regulated by the Financial Conduct Authority (License Number 191916); issued in the European Economic Area (EEA) by Northern Trust Fund Managers (Ireland) Limited, regulated by the Central Bank of Ireland (License Number C21810); issued in Australia by Northern Trust Asset Management (Australia) Limited (ACN 648 476 019), which holds an Australian Financial Services Licence (License Number 529895) and is regulated by the Australian Securities and Investments Commission (ASIC); issued in Hong Kong by The Northern Trust Company of Hong Kong Limited, which is regulated by the Hong Kong Securities and Futures Commission; and issued in Singapore by The Northern Trust Company (Singapore Branch), which is regulated by the Monetary Authority of Singapore.
For Canada, Asia-Pacific (APAC) and Europe, Middle East and Africa (EMEA) markets, this information is directed to institutional, professional and wholesale clients or investors only and should not be relied upon by retail clients or investors. This information may not be edited, altered, revised, paraphrased, or otherwise modified without the prior written permission of NTAM. The information is not intended for distribution or use by any person in any jurisdiction where such distribution would be contrary to local law or regulation. NTAM may have positions in and may effect transactions in the markets, contracts and related investments different than described in this information. This information is obtained from sources believed to be reliable, its accuracy and completeness are not guaranteed, and is subject to change. Information does not constitute a recommendation of any investment strategy, is not intended as investment advice and does not take into account all the circumstances of each investor.
This information is provided for informational purposes only and is not intended to be, and should not be construed as, an offer, solicitation or recommendation with respect to any transaction and should not be treated as legal advice, investment advice or tax advice. Recipients should not rely upon this information as a substitute for obtaining specific legal or tax advice from their own professional legal or tax advisors. References to specific securities and their issuers are for illustrative purposes only and are not intended and should not be interpreted as recommendations to purchase or sell such securities. Indices and trademarks are the property of their respective owners. Information is subject to change based on market or other conditions.
All securities investing and trading activities risk the loss of capital. Each portfolio is subject to substantial risks including market risks, strategy risks, advisor risk, and risks with respect to its investment in other structures. There can be no assurance that any portfolio investment objectives will be achieved, or that any investment will achieve profits or avoid incurring substantial losses. No investment strategy or risk management technique can guarantee returns or eliminate risk in any market environment. Risk controls and models do not promise any level of performance or guarantee against loss of principal. Any discussion of risk management is intended to describe NTAM’s efforts to monitor and manage risk but does not imply low risk.
Past performance is not a guarantee of future results. Performance returns and the principal value of an investment will fluctuate. Performance returns contained herein are subject to revision by NTAM. Comparative indices shown are provided as an indication of the performance of a particular segment of the capital markets and/or alternative strategies in general. Index performance returns do not reflect any management fees, transaction costs or expenses. It is not possible to invest directly in any index. Net performance returns are reduced by investment management fees and other expenses relating to the management of the account. Gross performance returns contained herein include reinvestment of dividends and other earnings, transaction costs, and all fees and expenses other than investment management fees, unless indicated otherwise. For U.S. NTI prospects or clients, please refer to Part 2a of the Form ADV or consult an NTI representative for additional information on fees.
Forward-looking statements and assumptions are NTAM’s current estimates or expectations of future events or future results based upon proprietary research and should not be construed as an estimate or promise of results that a portfolio may achieve. Actual results could differ materially from the results indicated by this information. Historical trends are not predictive of future results.
Not FDIC insured | May lose value | No bank guarantee