Municipal Bonds: Fiscal 2026 State Outlook
Despite policy risks, states are generally well-prepared for potential economic weakness due to strong reserves, moderate fixed costs, and their ability to adjust to changing conditions.
KEY POINTS
What it is
Fiscal 2026 begins with states holding strong reserves and cautious spending plans, providing cushion against economic and event risks. Budget sustainability is a key focus as federal support—especially for Medicaid—wanes.
Why it matters
Reserves and flexible tools help states absorb economic shocks, policy shifts, and climate risks, yet even strong positions like New York and California face growing federal scrutiny.
Where it's going
States continue to show strong resiliency, with even weaker credits making gains through reserve building, pension funding, and disciplined fiscal management.
The economy slowed during the first half of 2025 but avoided recession. Interest rates have remained higher for longer than expected, although Federal Reserve cuts are likely in the coming months. State tax revenues have remained strong, as the economy stayed resilient and capital gains boosted income tax revenues. States are generally well-prepared for potential economic weakness due to strong reserves, moderate fixed costs, and their ability to adjust to changing conditions.
Revenues Perform Well; Reserves Remain Robust
The U.S. economy has thus far avoided recession, yet growth has decelerated and economic risks persist. Tax revenues have remained strong, and most states either met or exceeded revenue targets for fiscal 2025, with revenues estimated upward at 3%. States project just under 3% revenue growth for fiscal 2026 on average, which we see as realistic. While this is far slower than the extraordinary gains of 17% and 16% in fiscal 2021 and 2022, it aligns closely with trends observed during the previous decade. This slower revenue growth has led states to rein in spending plans for fiscal 2026, which began on July 1 in most states.
The two main sources of state tax revenues are income and sales taxes. Sales tax growth is tepid but steady, boosted by inflation, which is still tracking ahead of pre-pandemic norms. Income tax has provided more growth, with recent estimates from the National Association of State Budget Officers (NASBO) showing 6.7% growth for fiscal 2025 and a projection of just under 5% for fiscal 2026. New York’s progressive income tax, which is sensitive to capital gains, posted 14% growth for the fiscal year ending March 31 and is up another 16% through the first four months of fiscal 2026.
States have generally kept tax regimes stable in recent years. NASBO reported that during the fiscal 2026 budget cycle, governors proposed just $6.6 billion in tax cuts and $6 billion in tax increases. Several southern states, Louisiana and Mississippi, for example, are reducing income tax rates in favor of sales taxes in recent years. We view this as credit neutral, as long as states maintain structural budget balance during this process.
EXHIBIT 1: KEY STATE TAX REVENUE
Major state taxes performed well during fiscal 2025, especially income tax.
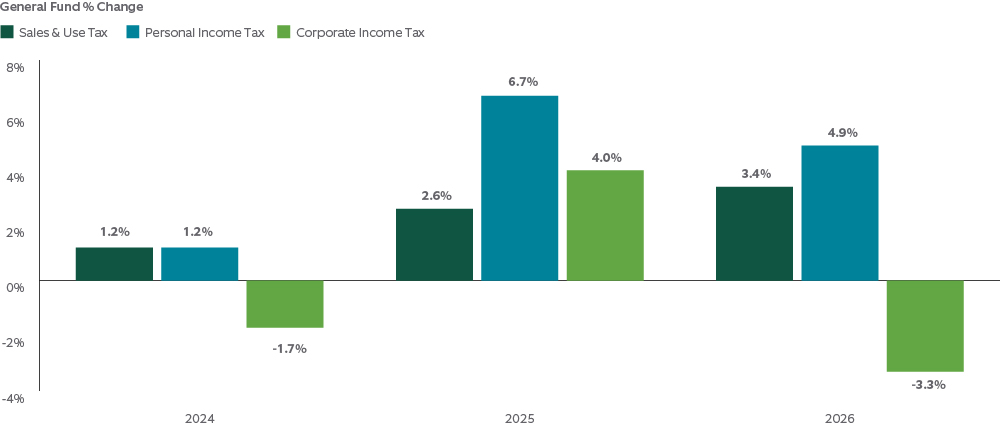
Source: National Association of State Budget Officers, Survey of the States, 2025. Fiscal 2025 are estimated figures and fiscal 2026 are figures recommended by governors.
Following the Global Financial Crisis, states of all political stripes focused on building rainy day reserves, which grew gradually during the 2010s, then more than doubled due to significant revenue outperformance in fiscal 2021 and 2022. Rainy day funds peaked in fiscal 2023 and are estimated to finish fiscal 2025 at $164 billion—13% of annual general fund spending and more than 2.5 times the level of 2007. Most states budgeted to maintain or increase reserves in fiscal 2026, preserving a healthy margin of safety for underperforming revenues or unexpected expenses. Even chronically under-reserved states like Illinois have seen improvements. The Land of Lincoln closed fiscal 2025 with nearly $2.4 billion (4% of annual spending) in its rainy day fund, compared to zero before the pandemic. This has earned the state three rounds of credit upgrades and tighter credit spreads, although it remains the weakest state credit.
EXHIBIT 2: HISTORICAL STATE RESERVES
States gradually added reserves during the 2010s, which then grew quickly during the pandemic.
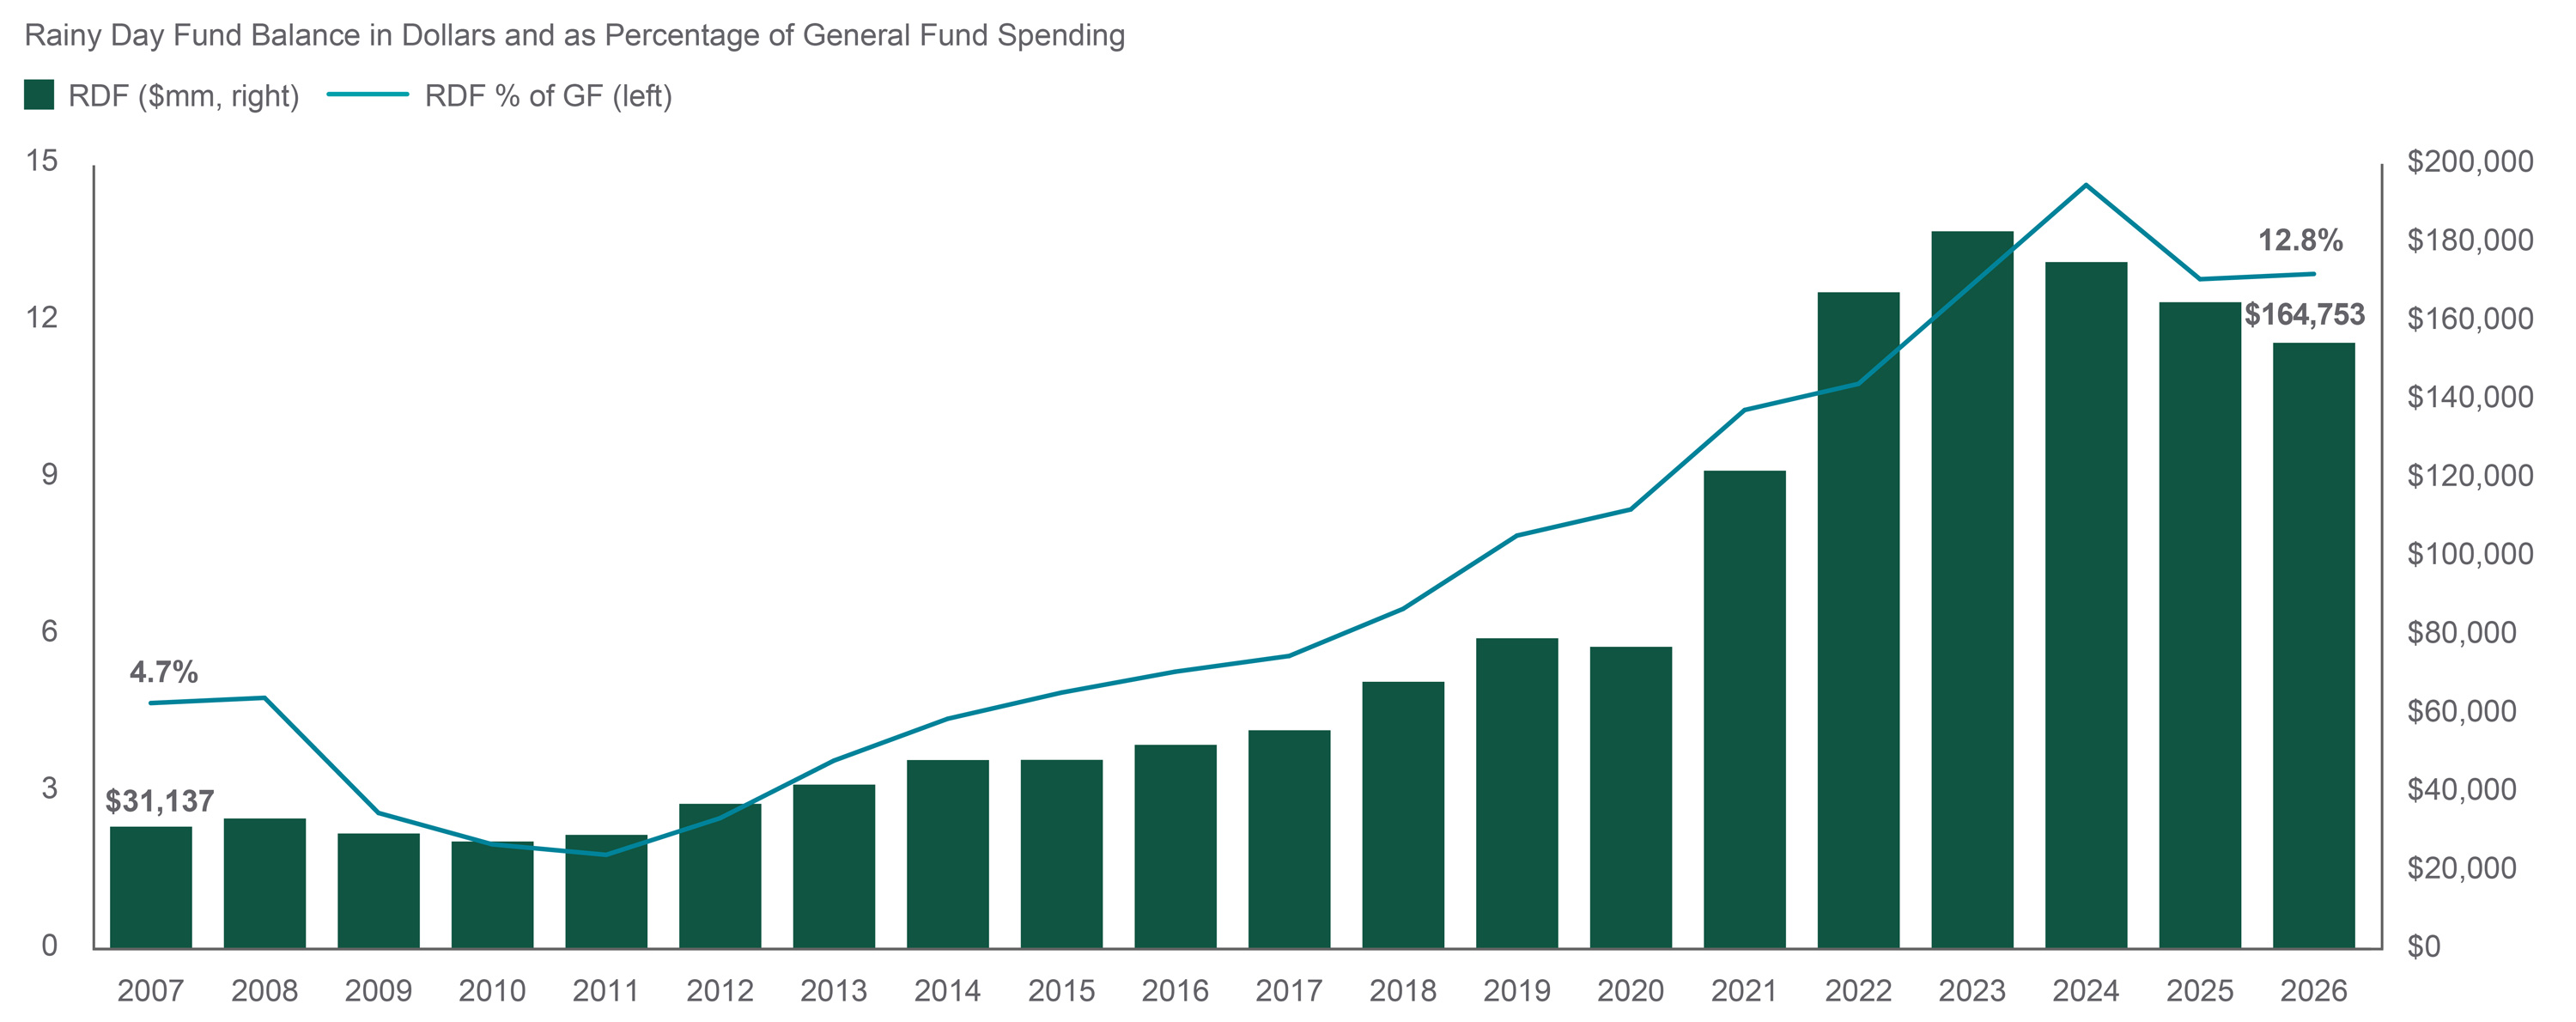
Source: National Association of State Budget Officers, Survey of the States, 2025. Fiscal 2025 are estimated figures and fiscal 2026 are figures recommended by governors.
States, facing economic and policy uncertainty, were cautious in fiscal 2026 budgets. Illinois, for example, increased total spending by just 2.9% despite a 4% increase in its budgeted pension contribution. Illinois also cut health benefits for 33,000 non-citizen adults starting in fiscal 2026. California’s total spending is expected to decline by 2.3%, and it made cuts to its Medicare program, Medi-Cal.
Understanding State Resiliency
Even well-managed states experience financial volatility. Recessions hit state budgets from both sides: tax revenues decline while demand for safety net programs rises. Unexpected events, such as natural disasters, terrorist attacks, civil unrest, or pandemics, can radically alter state budget forecasts. States have fiscal tools to manage these events, including raising new revenues, reducing or delaying spending, refinancing debt, borrowing, or using reserves. These sovereign powers are a key reason we favor state bonds.
On a relative basis, state resiliency varies. Key factors in evaluating state resiliency include:
- Reserves: Reserves increase fiscal safety margins. Reserve accumulation is particularly important for states with volatile revenue structures—for example, California, with a heavy dependence on capital gains, and Alaska, with dependence on oil revenues.
- Fixed Costs: Legacy costs like pensions, retiree health, and debt service reduce budgeting flexibility. Light debt issuance and strong pension returns have eased fixed costs in recent years, although some states still face a heavy burden. New Jersey’s annual retirement costs, for example, are elevated with combined retirement contributions equaling more than two times annual debt service payments. Increased funding and strong investment returns helped New Jersey’s combined-retirement, plan-funded ratios improve to 50% in 2024 from 47% in 2023.
- Management: We prefer states that budget conservatively and can adjust revenue forecasts quickly when conditions warrant. Rhode Island, for example, has a statutory requirement that limits spending to 97% of estimated revenue , allocating the remaining 3% to the rainy day fund. This is designed to promote fiscal discipline and buffer shortfalls.
EXHIBIT 3: COMPARING STATE RESILIENCY IN CHALLENGING TIMES
Varying levels of state resilience reflect differences in fiscal strength, management strategies, and budget stability—or a combination of these factors.
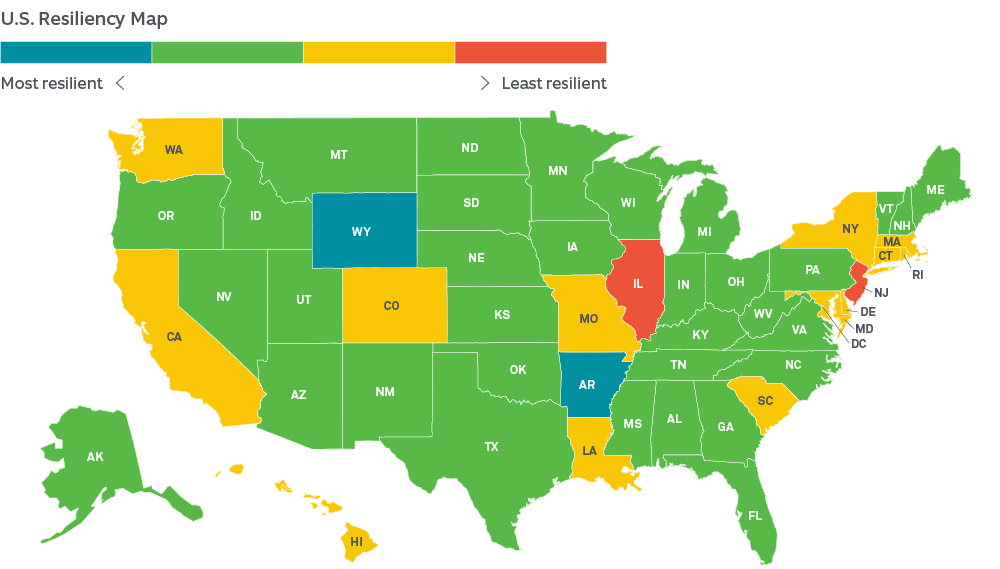
Source: Northern Trust Asset Management, our view of resiliency applies to the year starting July 1, 2024.
Federal Policy Shifts: OBBBA and Medicaid Funding Impacts
Federal policy changes remain a key pressure point for states heading into 2026, especially reduced funding for safety net programs like supplemental nutrition assistance (SNAP) and Medicaid. We see these cuts as challenging but manageable—around 1-3% of state budgets when fully implemented.
Federal revenues accounted for 36% of states’ revenues on average in 2023, with the largest portion of federal aid going to Medicaid, a joint federal-state program run by states. Federal funds cover two-thirds of Medicaid costs, but the passage of the federal tax bill, commonly known as the One Big Beautiful Bill Act or OBBBA, will shift more of that spending burden onto states.
The OBBBA reduces federal Medicaid spending by nearly $800 billion over the next 10 years, primarily affecting Medicaid expansion states. Estimates from the Kaiser Family Foundation show average funding reductions over the next 10 years is around 6% for non-expansion states and 14% for expansion states. States must choose between the unpleasant choice of reducing coverage or increasing their own resources to maintain coverage. In New York, for example, court rulings require maintaining coverage for certain populations no longer eligible under federal requirements. New York estimates the cost of maintaining that coverage will rise from $750 million in 2026 to close to $2.7 billion in 2027. States also face increased administrative costs, including investments in technology and staffing to comply with new federal requirements. Finally, states with large rural populations will face pressure to support small hospitals, which are particularly vulnerable to Medicaid cuts.
OBBBA poses headwinds, but most changes are delayed until fiscal 2028. Current financial strength gives states a buffer as they move through the transition.
Event Risk and States
States depend on federal aid for disaster recovery, primarily through the Federal Emergency Management Agency (FEMA) and one-time Congressional appropriations. While the federal government has responded generously in recent decades, aid is not guaranteed. U.S. President Donald Trump has expressed interest in winding down FEMA, leaving disaster recovery to the states, which would increase risks to state budgets. Federal disaster aid has continued under the Trump administration, though sometimes only after court orders and delays.
States can act proactively. First, the potential end of FEMA underscores the importance of accumulating and preserving rainy day funds for emergency liquidity. Second, risk assessment help states understand their vulnerabilities. New Jersey is modernizing its land use rules to respond to climate change risks, such as sea level rise and chronic flooding. Finally, capital projects can improve resiliency by hardening valuable assets in vulnerable areas. States will largely fund these projects themselves, as some federal grants were diverted, though temporarily blocked by a court.
California
Golden State issuers make up over 16% of the municipal market, by far the most of any state. California’s tax revenues are volatile due to its heavy dependence on a highly progressive income tax and its large tech industry. The state reduced its revenue forecast for the fiscal year 2026 starting July 1 due to assumed slower revenue growth after President Trump announced tariffs in April. In response, the legislature passed a budget with significant ongoing revenue cuts, including Medi-Cal, the state’s Medicaid program. The budget also anticipates reserve use but expects to end fiscal 2026 with a total of $22 billion in combined fund balance and reserves, around 10% of its annual budget. California faces high event risk (earthquakes, fires, and other disasters), but its large, diverse economy lessens the impact of any single disaster on state credit. We remain constructive on California’s credit due to strong reserves, liquidity, well-controlled liabilities, and sound fiscal management.
New York
New York faces challenges ahead but enters fiscal 2026 from a position of strength. Revenue growth remains strong and has exceeded estimates: receipts grew 10% for the fiscal year ending March 30, and 11% for the first quarter of fiscal 2026. This revenue outperformance has driven rainy day reserves to all-time highs. New York’s early start to the fiscal year forced policy-makers into decisions before the passage of the OBBBA. Projected outyear budget gaps are expected to widen due to reduced federal funding, but less than half of those during the 2008 Global Financial Crisis. Gaps should remain manageable, given the state’s historical track record of strong fiscal management and the buffer provided by record level reserves.
Texas and Florida
Texas and Florida are two of the largest municipal bond issuers, supported by rapid population growth and exceptionally strong fiscal positions. Both ended fiscal 2024 with record rainy day fund balances—15% and 7% of annual general fund revenues respectively. Neither state levies a personal income tax, instead relying heavily on sales taxes, which exposes them to economic cycles. Still, revenue performance has been good: Texas’ sales tax collections rose 3.4% year-over-year through July 2025, and Florida’s rose 2.5% through June. Environmental pressures are key risks, with both states facing extreme weather events. Elevated environmental risk, combined with population growth, drives a growing need for investment in resilient infrastructure in these states. Both states also face pressure from local taxpayers as property taxes rise. Texas and Florida’s robust reserves and low debt levels position them well to manage volatility and preserve long-term credit strength.
Conclusion: What This Means for Municipal Bond Investors
States enter fiscal 2026 in a strong position, supported by sizable reserves and moderating fixed costs. While the economic outlook and policy environment remain unsettled, strong resiliency should limit credit downgrades and spread volatility. We continue to view state bonds as a core component of municipal portfolios.
Meet Your Expert
John Ceffalio
Head of Municipal Credit and Strategy — Global Fixed Income
John Ceffalio is the head of municipal credit and strategy on the global fixed income team at Northern Trust Asset Management. He joined Northern Trust in January 2023. John manages our 7-member municipal credit research team. He also delivers client-facing communications that advance engagement with our clients as we offer deep expertise about the municipal bond market and their portfolios.

IMPORTANT INFORMATION
Northern Trust Asset Management is composed of Northern Trust Investments, Inc., Northern Trust Global Investments Limited, Northern Trust Fund Managers (Ireland) Limited, Northern Trust Global Investments Japan, K.K., NT Global Advisors, Inc., 50 South Capital Advisors, LLC, Northern Trust Asset Management Australia Pty Ltd, and investment personnel of The Northern Trust Company, The Northern Trust Company (Singapore Branch), and The Northern Trust Company of Hong Kong Limited.
Issued in the United Kingdom by Northern Trust Global Investments Limited, regulated by the Financial Conduct Authority (License Number 191916); issued in the European Economic Area (EEA) by Northern Trust Fund Managers (Ireland) Limited, regulated by the Central Bank of Ireland (License Number C21810); issued in Australia by Northern Trust Asset Management (Australia) Limited (ACN 648 476 019), which holds an Australian Financial Services Licence (License Number 529895) and is regulated by the Australian Securities and Investments Commission (ASIC); issued in Hong Kong by The Northern Trust Company of Hong Kong Limited, which is regulated by the Hong Kong Securities and Futures Commission; and issued in Singapore by The Northern Trust Company (Singapore Branch), which is regulated by the Monetary Authority of Singapore.
For Canada, Asia-Pacific (APAC) and Europe, Middle East and Africa (EMEA) markets, this information is directed to institutional, professional and wholesale clients or investors only and should not be relied upon by retail clients or investors. This information may not be edited, altered, revised, paraphrased, or otherwise modified without the prior written permission of NTAM. The information is not intended for distribution or use by any person in any jurisdiction where such distribution would be contrary to local law or regulation. NTAM may have positions in and may effect transactions in the markets, contracts and related investments different than described in this information. This information is obtained from sources believed to be reliable, its accuracy and completeness are not guaranteed, and is subject to change. Information does not constitute a recommendation of any investment strategy, is not intended as investment advice and does not take into account all the circumstances of each investor.
This information is provided for informational purposes only and is not intended to be, and should not be construed as, an offer, solicitation or recommendation with respect to any transaction and should not be treated as legal advice, investment advice or tax advice. Recipients should not rely upon this information as a substitute for obtaining specific legal or tax advice from their own professional legal or tax advisors. References to specific securities and their issuers are for illustrative purposes only and are not intended and should not be interpreted as recommendations to purchase or sell such securities. Indices and trademarks are the property of their respective owners. Information is subject to change based on market or other conditions.
All securities investing and trading activities risk the loss of capital. Each portfolio is subject to substantial risks including market risks, strategy risks, advisor risk, and risks with respect to its investment in other structures. There can be no assurance that any portfolio investment objectives will be achieved, or that any investment will achieve profits or avoid incurring substantial losses. No investment strategy or risk management technique can guarantee returns or eliminate risk in any market environment. Risk controls and models do not promise any level of performance or guarantee against loss of principal. Any discussion of risk management is intended to describe NTAM’s efforts to monitor and manage risk but does not imply low risk.
Past performance is not a guarantee of future results. Performance returns and the principal value of an investment will fluctuate. Performance returns contained herein are subject to revision by NTAM. Comparative indices shown are provided as an indication of the performance of a particular segment of the capital markets and/or alternative strategies in general. Index performance returns do not reflect any management fees, transaction costs or expenses. It is not possible to invest directly in any index. Net performance returns are reduced by investment management fees and other expenses relating to the management of the account. Gross performance returns contained herein include reinvestment of dividends and other earnings, transaction costs, and all fees and expenses other than investment management fees, unless indicated otherwise. For U.S. NTI prospects or clients, please refer to Part 2a of the Form ADV or consult an NTI representative for additional information on fees.
Forward-looking statements and assumptions are NTAM’s current estimates or expectations of future events or future results based upon proprietary research and should not be construed as an estimate or promise of results that a portfolio may achieve. Actual results could differ materially from the results indicated by this information. Historical trends are not predictive of future results.
Not FDIC insured | May lose value | No bank guarantee