Trade Tariffs: What History Teaches Us to Mitigate Their Impact
Historical pricing and stock market data provide an indicator of how markets respond to high- and low-tariff environments.
KEY POINTS
What it is
Pricing data show how markets behaved when tariffs were previously high and offer insights for navigating the current tariff-driven market uncertainty.
Why it matters
Markets have not experienced a high tariff regime since before World War II, when global trade was significantly less integrated than today.
Where it's going
Low volatility factor may be especially helpful in constructing a portfolio that can withstand market shocks caused by high tariffs.
A KEY PLANK of the new administration’s economic policy has been to embrace tariffs, a sharp reversal of decades of free market trade. This fresh wave of protectionist measures has affected almost all U.S. trading partners and sparked significant market volatility. Investors are understandably keen to calculate the implications of this policy shift: How do tariffs affect economic growth and asset returns, and is there anything they can do to mute their impact?
While today’s circumstances may feel unprecedented, certainly for a generation that has grown up with globalization, it is far from uncharted. Historical market data provides valuable guidance in addressing the current financial unease.
Previous tariff regimes
The U.S. has experienced several high-tariff regimes over the past 150 years (Exhibit 1). They first became a feature of the U.S. economy during the second half of the 19th century, sparked initially by the country’s desire to generate revenue to fund the Civil War. Protectionism peaked with 1897’s Dingley Tariff as the U.S. sought to nurture flourishing industries.
A period of liberalization to encourage American manufacturers to become more competitive began in 1913 but ended abruptly with the stock market crash of 1929. The subsequent downturn ushered in a new era of protectionism as countries sought to shore up domestic industries and jobs. The Smoot-Hawley Tariff Act, introduced by the U.S. in 1930, raised tariffs to historically high levels of about 45%. But rather than protect farmers and manufacturers, the levies merely triggered a collapse in worldwide trade.
Exhibit 1: Downward Tariff Trend
Tariffs peaked around the turn of the last century and have been relatively low since the end of World War II
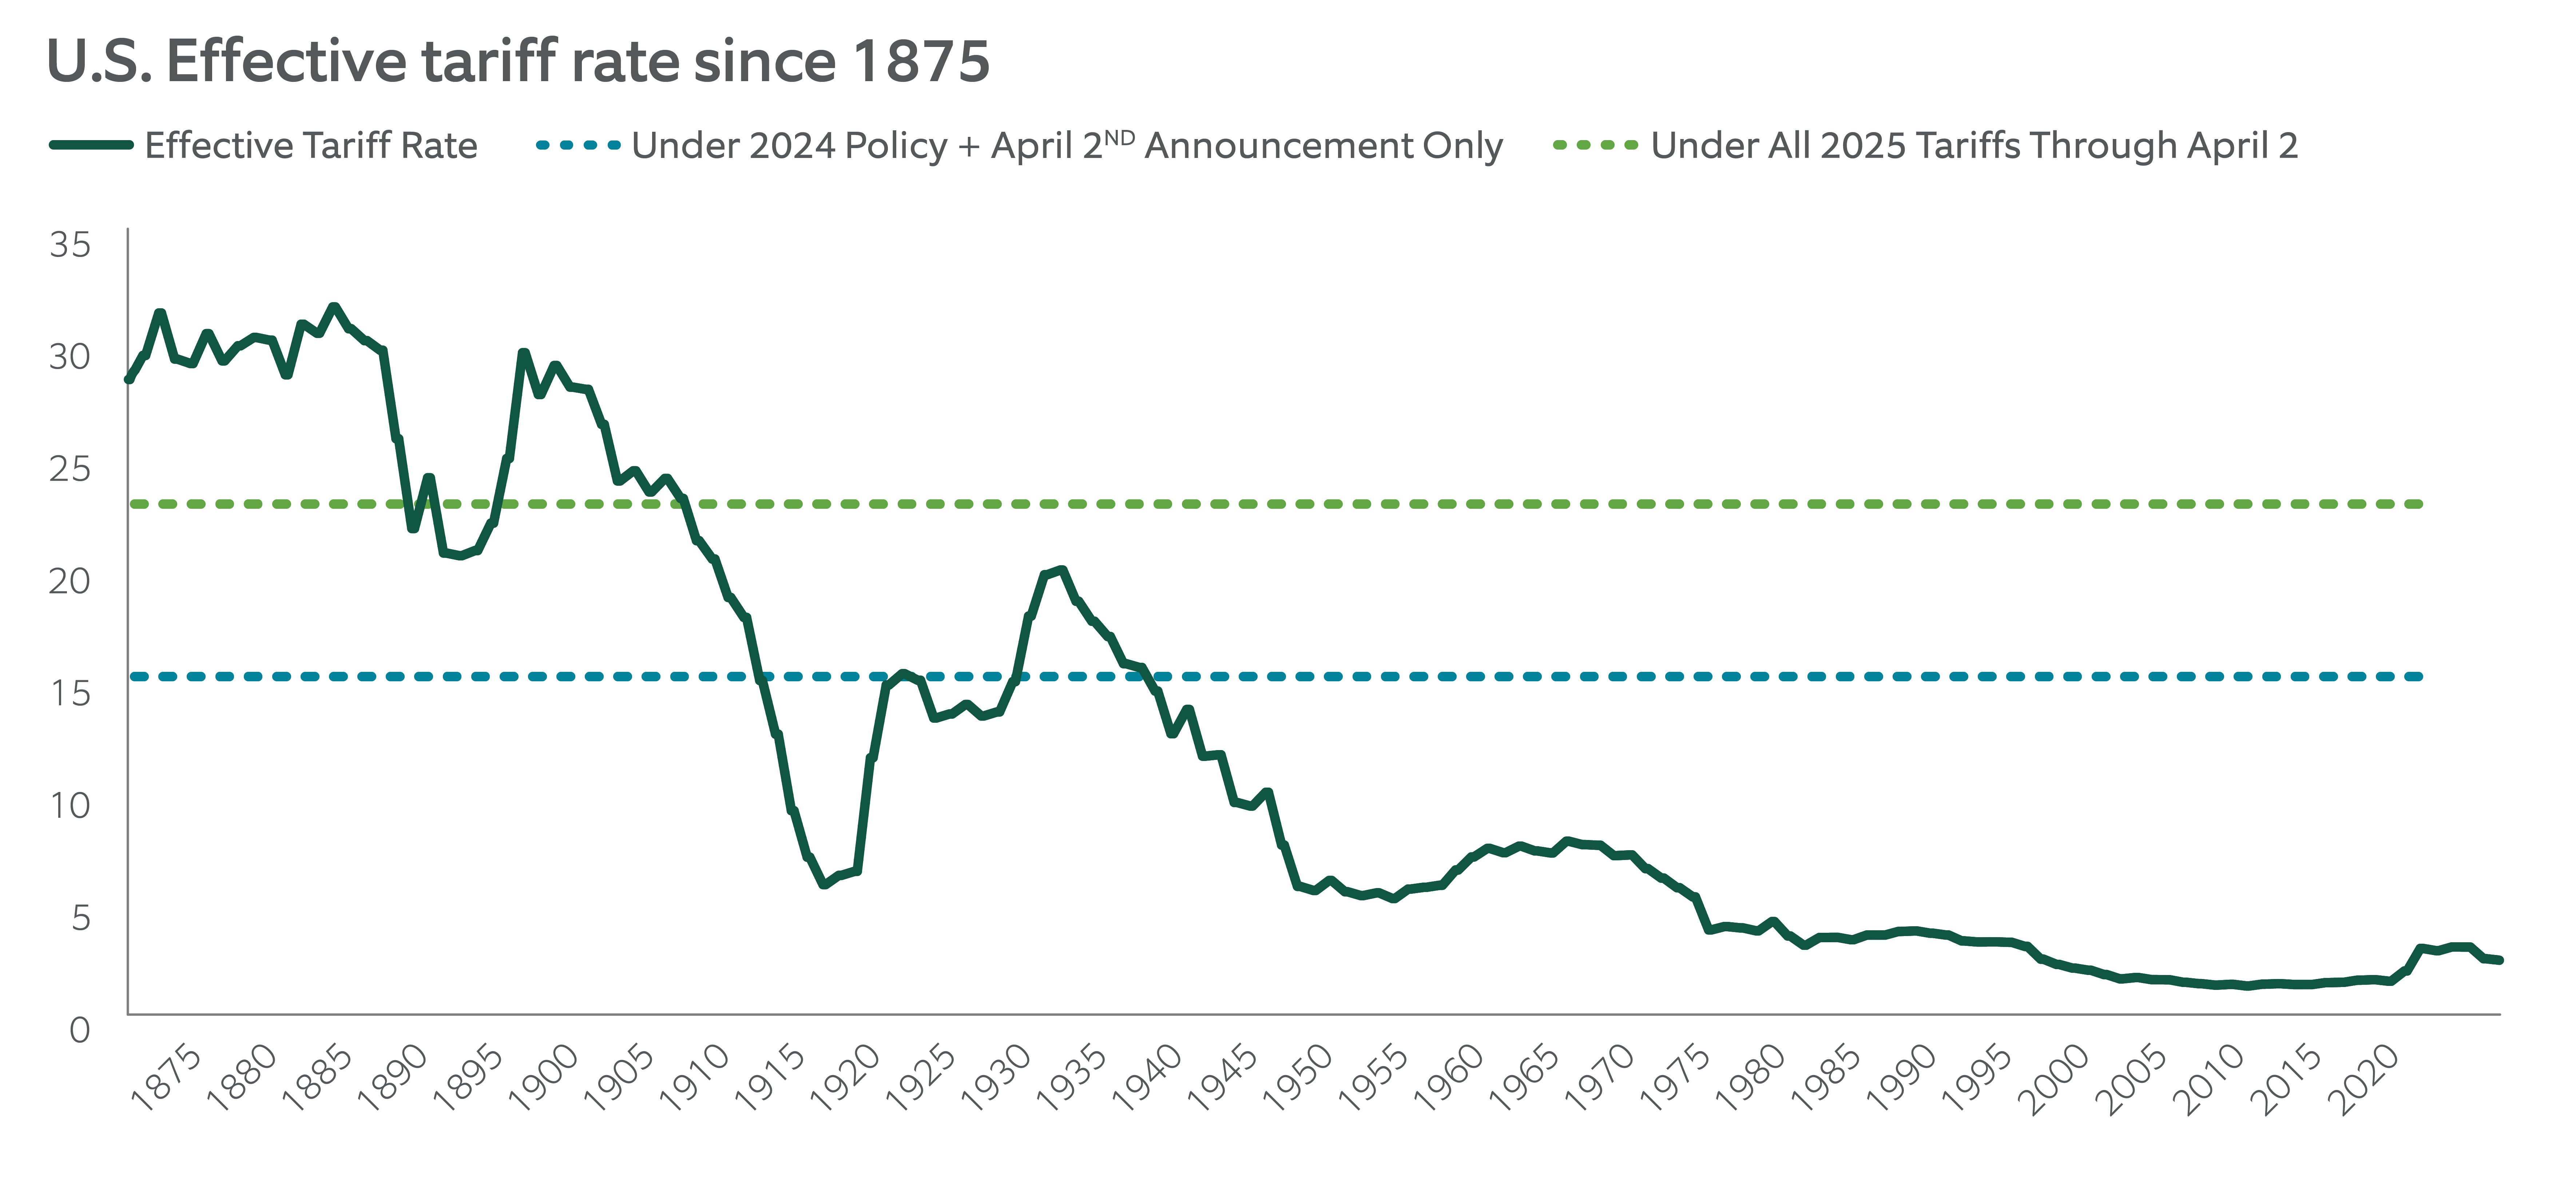
Source: Yale BudgetLab and Northern Trust Asset Management – Quantitative Strategies. The effective U.S. tariff rate is measured as customs duty revenue as a percent of goods imports. The sample period is 1875-2024.
In the decades since, use of tariffs has dwindled as liberalized trade became the norm. By the 2010s, the average tariff on U.S. imports had dropped to 1.5–2.5%. This trend has reversed under both of U.S. President Donald Trump’s administrations. Beginning in 2018, the Trump administration imposed a series of tariffs, including a 10% tariff on certain imports such as aluminum, and additional levies targeting countries with large trade surpluses with the U.S., most notably China.
Tariffs and growth
Armed with 150 years-worth of data, we examine the performance of markets during previous high-tariff periods. History provides some sense of how markets might react this time.
While intuition – and decades of globalization - might link protectionism with weaker economic outcomes, the data shown in Exhibit 2 present a more nuanced picture.
Exhibit 2: More Growth with Higher Tariffs
Economic growth in the U.S. has tended to be marginally higher during high-tariff regimes
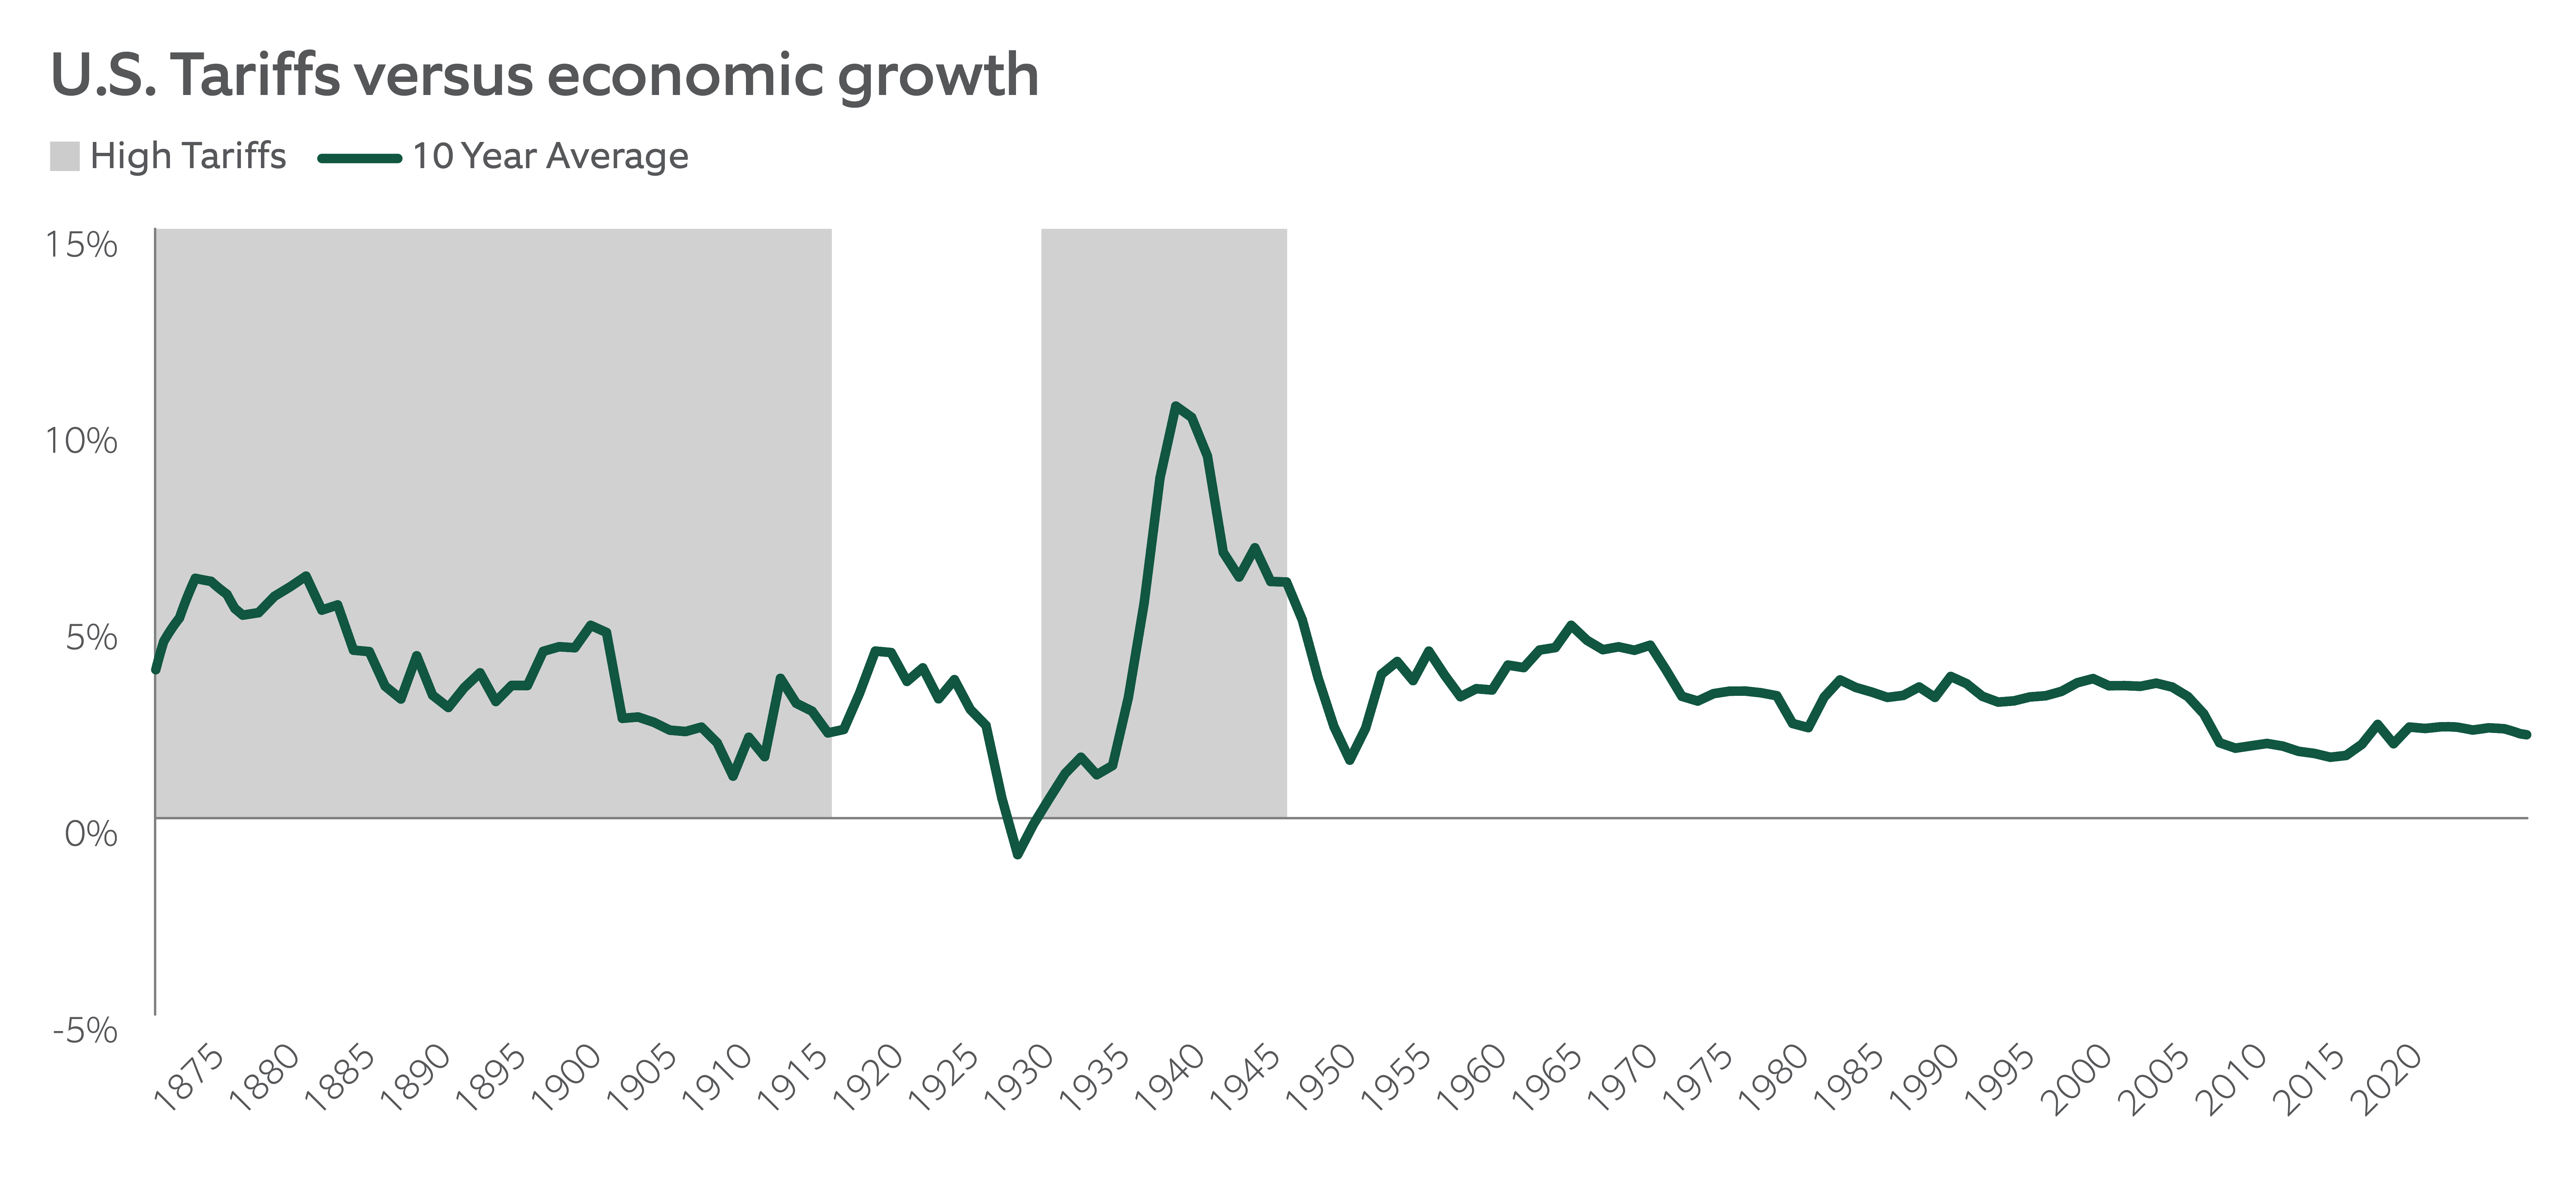
Source: GlobalMacroDatabase, Yale BudgetLab and Northern Trust Asset Management – Quantitative Strategies. The effective U.S. tariff rate is measured as customs duty revenue as a percent of goods imports. U.S. economic growth is measured by the 10 years (centered) average growth rate in real GDP.
In terms of overall economic growth, research has yielded mixed results, with some periods showing positive correlations between high tariffs and strong growth — especially before World War II. However, while tariffs dropped significantly in the decades since the end of World War II, economic growth also fell to levels below those seen during the peak protectionist era, and has been at 2.2% since the turn of the 21st century, down from 3.2% in the aftermath of the war.
It is worth noting that trade differs significantly today than when it was conducted a century or more ago. The global economy is now more interconnected, with intricate international supply chains, while trade has become a much larger share of the global economy. But some things don’t change: by and large, investor behavior, policy feedback loops, and the underlying mechanics of pricing risk are all constants.
Despite these fundamentals, the present market dynamics suggest that the opportunity cost of retreating behind protectionist walls may be considerably greater today than in the past.
Tariffs and the markets
Exhibit 3 shows that equities performed well during previous high-tariff periods, with annual real returns averaging 5.3% during the protectionist peak and 5.1% during the Smoot-Hawley era, broadly in line with the long-term average over the past 150 years. Bond returns were more modest, at 2.7% and 1.1% respectively. Equity factor portfolios consistently outperformed the broad market, adding approximately 2.0% in both high-tariff regimes.
The results for bonds and equities are similar when we look at returns based on the absolute level of U.S. effective tariffs, using a cutoff of 15% to delineate between high- and low-tariff periods. Equity factors, however, show a consistent value-add, delivering strong returns in both high- and low-tariff environments. In particular, low-volatility strategies performed well during high-tariff episodes, while size, value, and other factors also held up robustly.
Exhibit 3: A Difference in Bond Performance
Equities perform similarly whether tariffs are high or low, but bond returns are noticeably higher during low-tariff periods
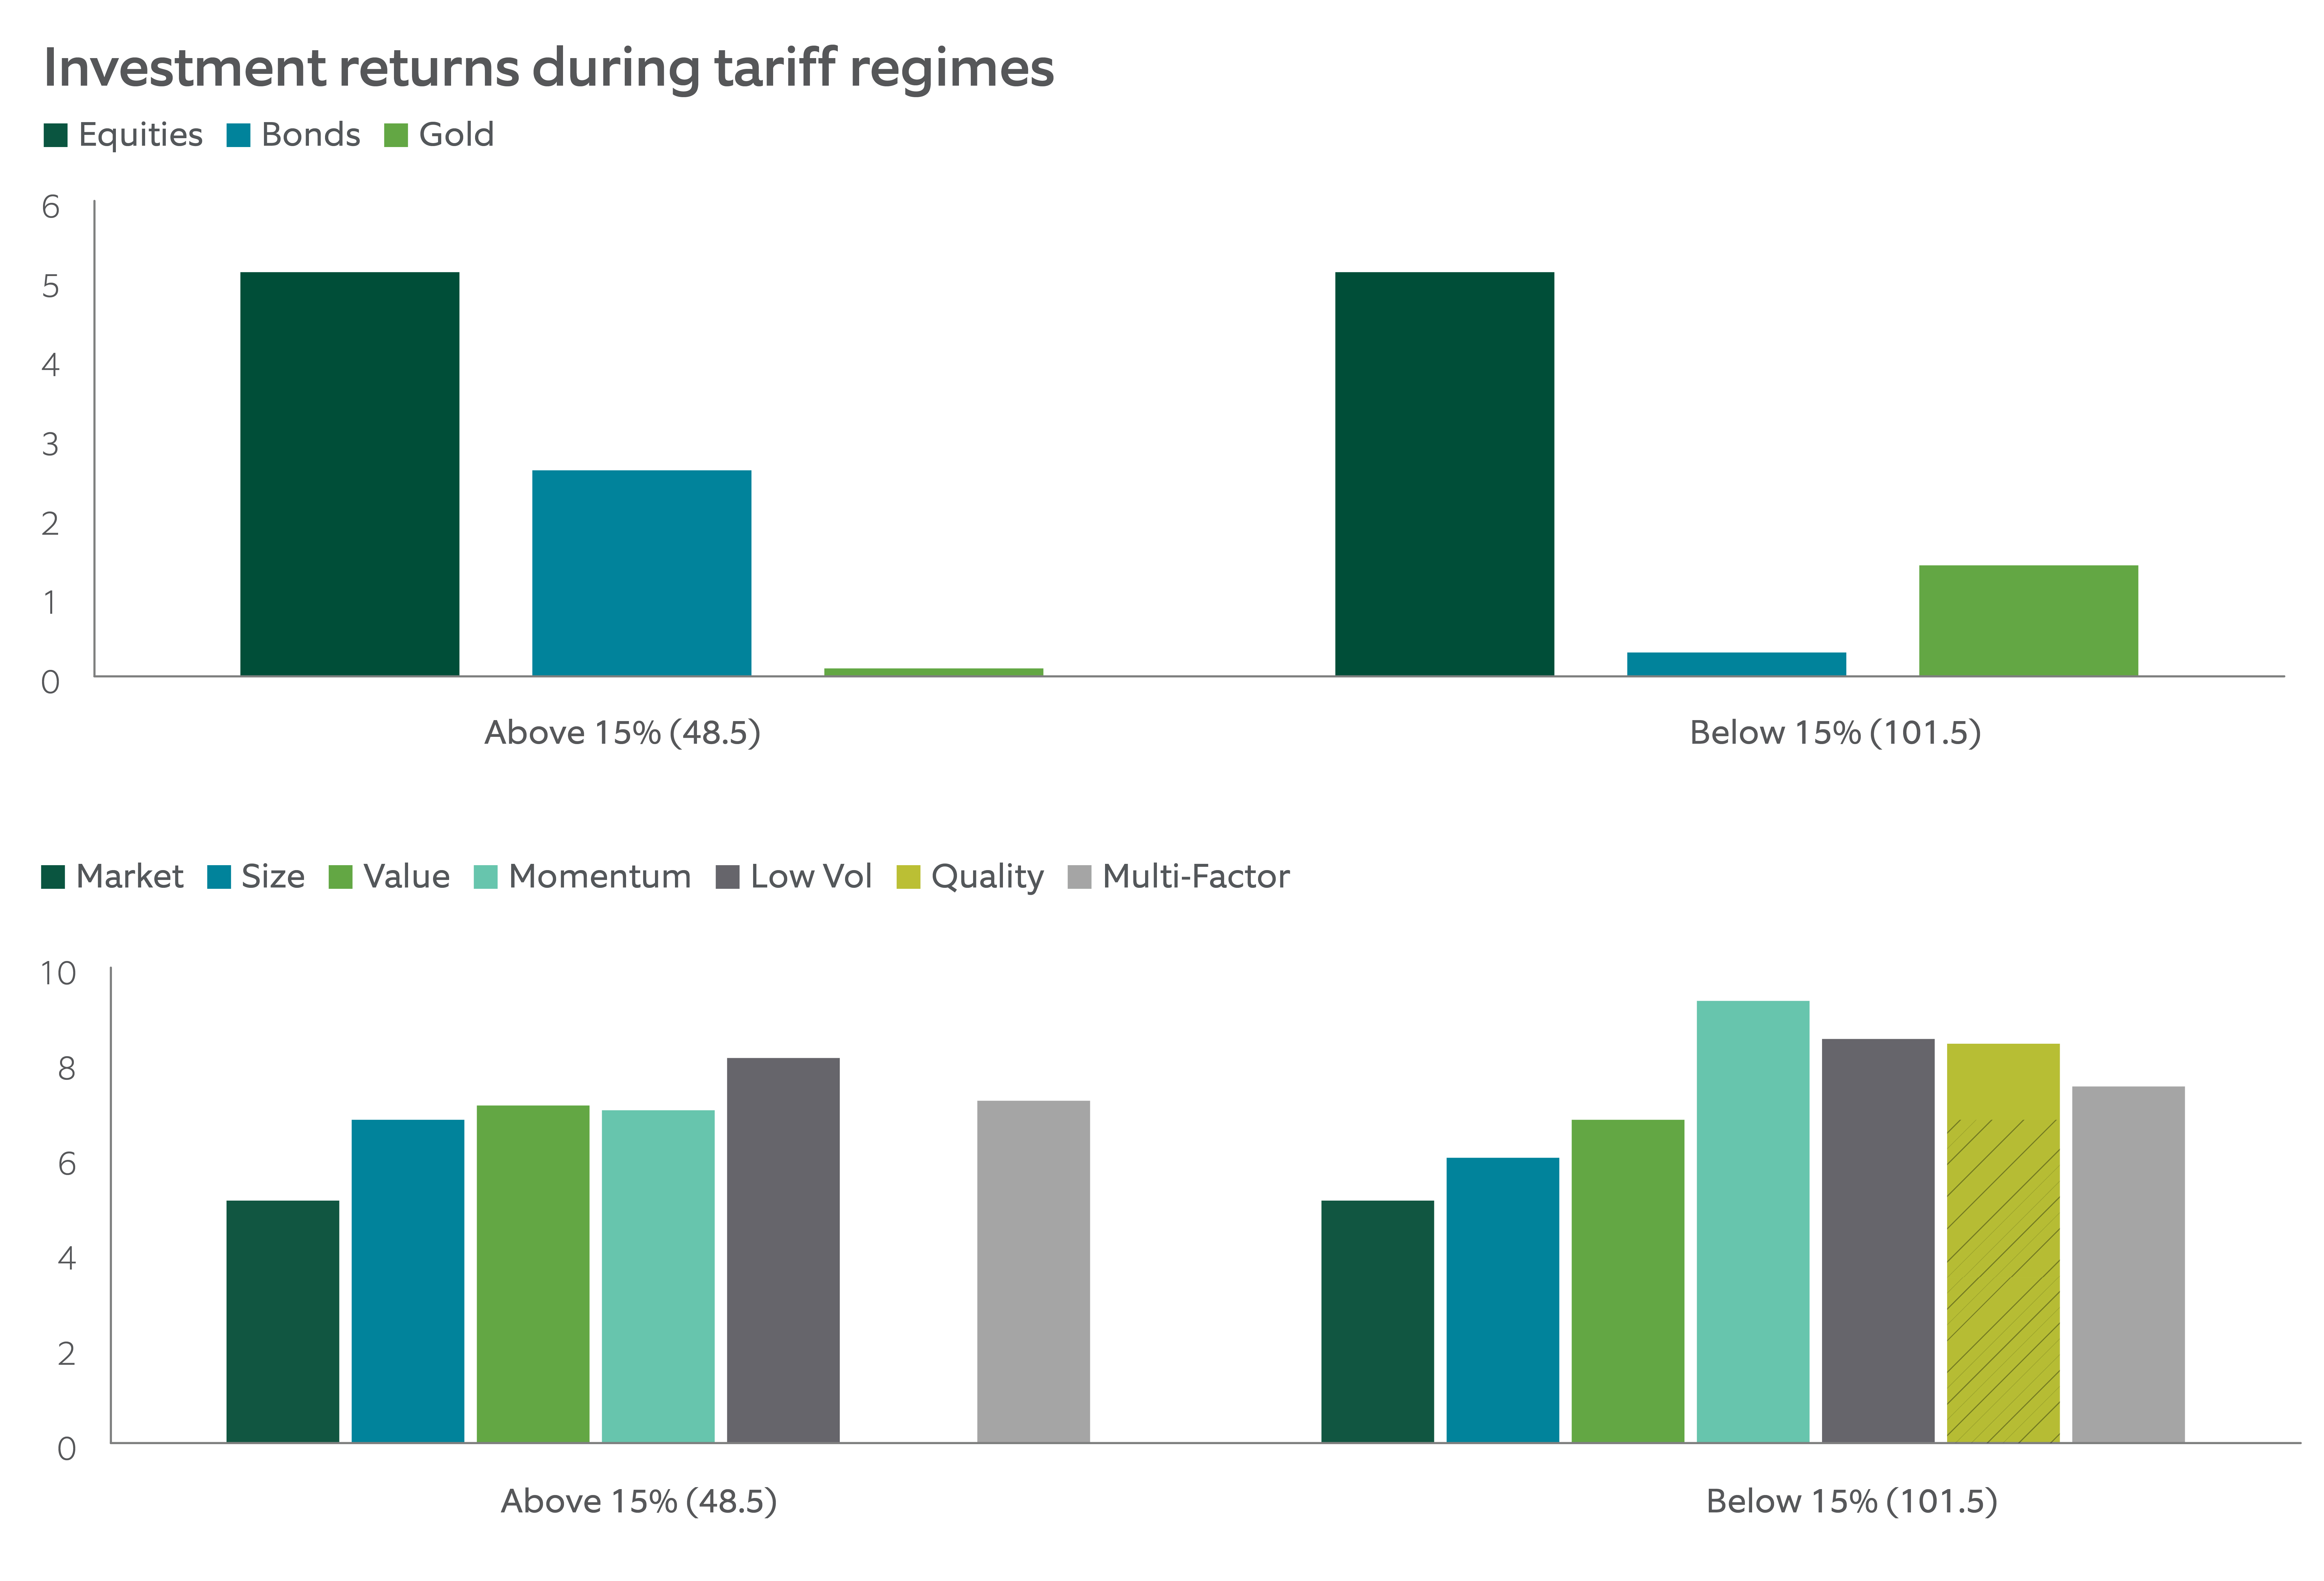
This graph does not show actual performance results. For illustrative purposes only. Past performance is no guarantee of future results. Index performance returns do not reflect any management fees, transaction costs or expenses. It is not possible to invest directly in any index.
Source: Baltussen et al. (2023), Yale BudgetLab and Northern Trust Asset Management – Quantitative Strategies. The effective U.S. tariff rate is measured as customs duty revenue as a percent of goods imports. Effective U.S. tariff rates are year-end values, replicated across July-to-June, centered around December. Factors are simulated. Data from January 1875 until December 2024, except for Quality which starts in 1940, given earlier data is not available for this factor. The Multi-Factor series includes all factors available at each point in time. The shaded part for quality represents the market return over the same period. Factors are constructed by overlaying long-short portfolios on the market portfolio. Returns are in annual terms, in USD. Numbers in parentheses indicate the average number of years per scenario.
These results provide some useful indicators as to how investors might deploy factors to ensure portfolios can withstand any tariff environment.
Elevated tariffs often increase input costs, compress profit margins, and heighten macroeconomic uncertainty conditions under which investors tend to favor more resilient, lower-risk companies. This supports low-volatility and quality factor outperformance.
At the same time, tariffs can weigh more heavily on cyclical and globally integrated firms, which are often concentrated in value and small-cap segments. However, when these factors are priced at deep discounts, they can still deliver strong returns, particularly if policy shocks reverse or are already priced in – which may explain their resilience, even in high-tariff regimes.
Consistent Value Through Tariffs
While high tariffs have historically coincided with episodes of volatility and reduced trade openness, economic growth and equity returns have — perhaps somewhat counterintuitively — remained relatively resilient.
Equity factors, in particular, have delivered consistent value over the market portfolio across both high- and low-tariff environments. The low-volatility factor stands out as especially effective during periods of market stress, while size and value have also held up well. Armed with these insights, investors may find it possible to navigate the current wave of uncertainty.
Main point
The new administration’s embracing of trade tariffs has created a bout of market uncertainty and volatility. But an investment approach incorporating equity factors may be helpful in navigating a path through the current turmoil.
IMPORTANT INFORMATION
Northern Trust Asset Management (NTAM) is composed of Northern Trust Investments, Inc., Northern Trust Global Investments Limited, Northern Trust Fund Managers (Ireland) Limited, Northern Trust Global Investments Japan, K.K, NT Global Advisors, Inc., 50 South Capital Advisors, LLC, Northern Trust Asset Management Australia Pty Ltd, and investment personnel of The Northern Trust Company of Hong Kong Limited and The Northern Trust Company.
Issued in the United Kingdom by Northern Trust Global Investments Limited, issued in the European Economic Association (“EEA”) by Northern Trust Fund Managers (Ireland) Limited, issued in Australia by Northern Trust Asset Management (Australia) Limited (ACN 648 476 019) which holds an Australian Financial Services Licence (License Number: 529895) and is regulated by the Australian Securities and Investments Commission (ASIC), and issued in Hong Kong by The Northern Trust Company of Hong Kong Limited which is regulated by the Hong Kong Securities and Futures Commission.
This information is directed to institutional, professional and wholesale current or prospective clients or investors only and should not be relied upon by retail clients or investors. This document may not be edited, altered, revised, paraphrased, or otherwise modified without the prior written permission of NTAM. The information is not intended for distribution or use by any person in any jurisdiction where such distribution would be contrary to local law or regulation. NTAM may have positions in and may effect transactions in the markets, contracts and related investments different than described in this information. This information is obtained from sources believed to be reliable, its accuracy and completeness are not guaranteed, and is subject to change. Information does not constitute a recommendation of any investment strategy, is not intended as investment advice and does not take into account all the circumstances of each investor.
This report is provided for informational purposes only and is not intended to be, and should not be construed as, an offer, solicitation or recommendation with respect to any transaction and should not be treated as legal advice, investment advice or tax advice. Recipients should not rely upon this information as a substitute for obtaining specific legal or tax advice from their own professional legal or tax advisors. References to specific securities and their issuers are for illustrative purposes only and are not intended and should not be interpreted as recommendations to purchase or sell such securities. Indices and trademarks are the property of their respective owners. Information is subject to change based on market or other conditions.
All securities investing and trading activities risk the loss of capital. Each portfolio is subject to substantial risks including market risks, strategy risks, advisor risk, and risks with respect to its investment in other structures. There can be no assurance that any portfolio investment objectives will be achieved, or that any investment will achieve profits or avoid incurring substantial losses. No investment strategy or risk management technique can guarantee returns or eliminate risk in any market environment. Risk controls and models do not promise any level of performance or guarantee against loss of principal. Any discussion of risk management is intended to describe NTAM’s efforts to monitor and manage risk but does not imply low risk.
Past performance is not a guarantee of future results. Performance returns and the principal value of an investment will fluctuate. Performance returns contained herein are subject to revision by NTAM. Comparative indices shown are provided as an indication of the performance of a particular segment of the capital markets and/or alternative strategies in general. Index performance returns do not reflect any management fees, transaction costs or expenses. It is not possible to invest directly in any index. Net performance returns are reduced by investment management fees and other expenses relating to the management of the account. Gross performance returns contained herein include reinvestment of dividends and other earnings, transaction costs, and all fees and expenses other than investment management fees, unless indicated otherwise. For U.S. NTI prospects or clients, please refer to Part 2a of the Form ADV or consult an NTI representative for additional information on fees.
Forward-looking statements and assumptions are NTAM’s current estimates or expectations of future events or future results based upon proprietary research and should not be construed as an estimate or promise of results that a portfolio may achieve. Actual results could differ materially from the results indicated by this information.
© 2025 Northern Trust Corporation. Head Office: 50 South La Salle Street, Chicago, Illinois 60603 U.S.A.