
POINT OF VIEW | 06.12.26
Upcoming Mega-Cap IPOs: Implications for Index Investors
The SpaceX IPO leads an incoming wave of mega-cap IPOs. For index investors, the key questions go beyond headline valuation — They focus on timing, float and index rules.
Mega-cap IPOs could create meaningful benchmark events, but index impact will depend on methodology details, not headlines.
A stock’s inclusion in an index is likely to be staggered, with timing and weight differences across benchmarks.
Disciplined index portfolio management and careful execution will be essential as these IPOs come to market.
The incoming wave of very large U.S. IPOs could become one of the most important index implementation events in recent years — beginning with the SpaceX IPO occurring on June 12, 2026. Market discussion has focused on other potential forthcoming IPOs including OpenAI, Anthropic and Databricks, where recent private-market valuation references imply that some new public companies could be large enough to matter immediately for major U.S. equity benchmarks. For index clients, the key question is not simply whether these companies go public, but how quickly they become eligible for major benchmarks, how much free float is available at the initial listing, how each index provider handles fast entry and lock-up releases, and whether implementation is concentrated into one event or phased over time.
- Provider treatment differs materially: Index providers FTSE and MSCI already maintain large IPO fast-entry frameworks; Nasdaq has implemented fast-track treatment for very large eligible companies; Russell has recently finalized an accelerated treatment for top-tier IPOs; and S&P’s recent consultation on the treatment of mega-cap companies resulted in no changes to its methodology for the index family that includes the S&P 500 Index, meaning companies must wait at least 12 months before consideration for index inclusion.
- Float matters as much as valuation: Headline company value may overstate initial index weight if only a small percentage of shares are freely tradable. A later lock-up release could be a larger index event than the IPO itself.
- Country and sector effects are measurable: SpaceX is assumed to be classified in Communication Services based on the revenue mix in its S-1 filing, while OpenAI and Anthropic are assumed to be classified in Information Technology.
- Implementation quality will be central: Large additions can create benchmark dispersion, trading demand, market-on-close pressure, turnover and short-term tracking risk. For a $1.5 billion USD MSCI World-equivalent portfolio, the combined exposure to SpaceX, OpenAI, and Anthropic would be approximately $3 million to $30 million in 5% and 50% float cases, respectively.
SPACEX DETAILS
The SpaceX IPO shifts the discussion from hypothetical mega-cap IPO mechanics to a more concrete index implementation roadmap. Listing on the Nasdaq Stock Exchange and Nasdaq Texas Exchange under ticker SPCX, it carries a dual-class share structure and a complex lock-up schedule that could release shares well before a traditional 180-day unlock. For index investors, the practical issue is no longer only whether SpaceX qualifies for fast entry; it is how quickly index providers add the IPO shares, how they handle subsequent float updates, and whether implementation can be aligned with actual liquidity events.
EXHIBIT 1: SPACEX S-1 DETAILS THAT MATTER FOR INDEX INVESTORS
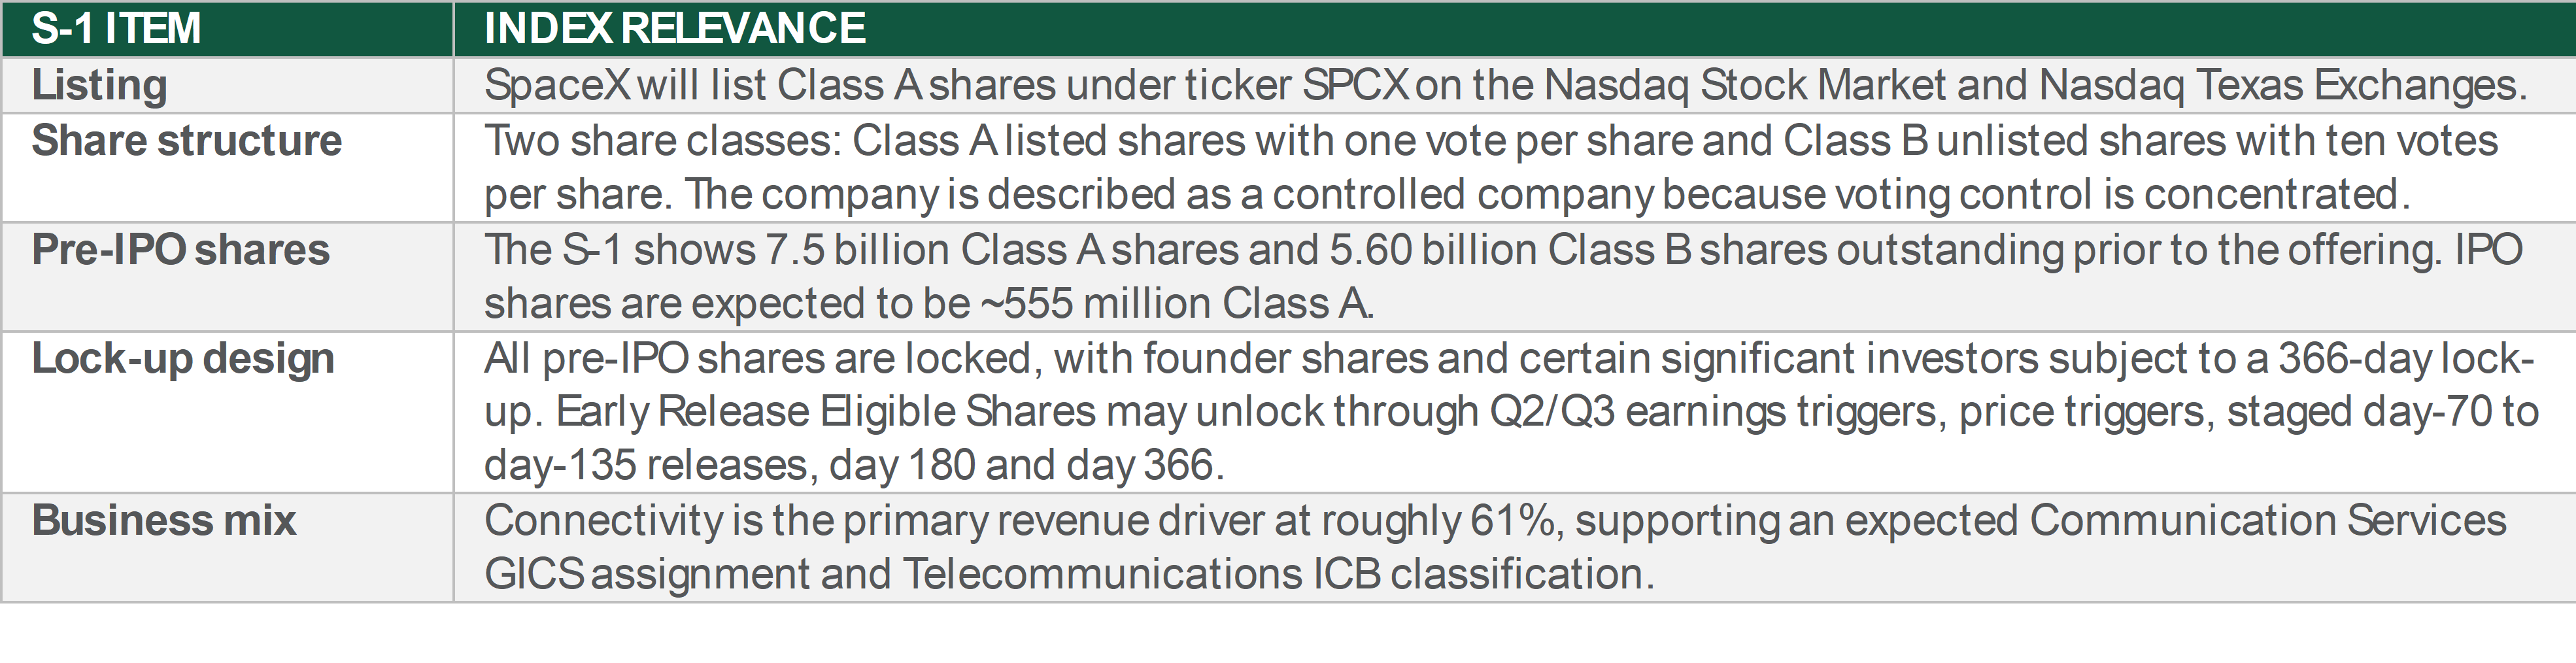
The dual-class structure, controlled-company profile, and lock-up design all matter for index implementation. The most immediate question is whether index providers use only the IPO share count at initial inclusion or make adjustments that reflect expected early-release shares. The second-order question is whether later float updates occur in concentrated events or phases.
INDEX PROVIDER TREATMANT: SIMILAR OBJECTIVE, DIFFERENT MECHANICS
EXHIBIT 2: IPO TREATMANT VARIES BY INDEX PROVIDER
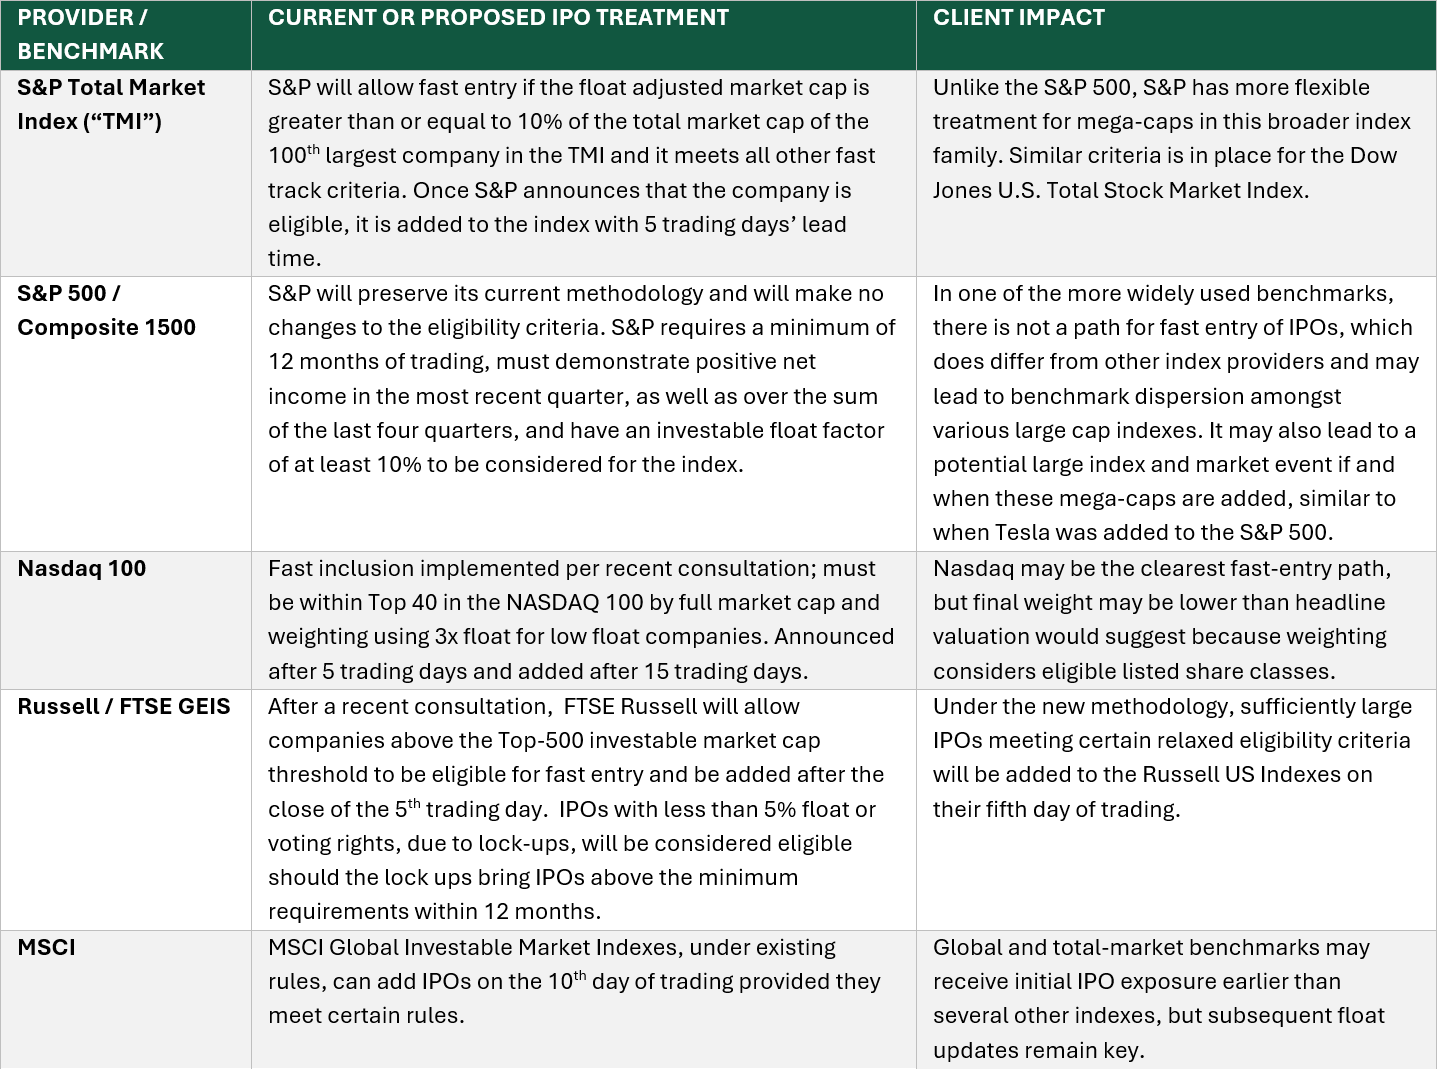
Source: S&P Dow Jones, FTSE Russell, NASDAQ, MSCI.
WHAT THIS MEANS FOR CLIENTS
- Benchmark dispersion: SpaceX, for example, may enter total market, Nasdaq, FTSE/Russell, MSCI and S&P benchmarks at different times and weights. Clients should expect benchmark-level differenc
- Tracking and trading costs: Initial inclusion may use IPO shares, while later float releases could create larger implementation events. Managers will need to balance benchmark replication with market liquidity and trading cost control.
- Sector and style exposure: For SpaceX, the S-1 revenue mix supports a Communication Services GICS expectation. Additionally, index providers may classify Mega-Cap IPOs differently when assessing and assigning their style definitions (i.e., Growth and Value).
- Client messaging: The most important message is that headline valuation is not the same as index weight. Initial weight depends on IPO shares and eligible float; later weight changes depend on unlocks and provider implementation decisions.
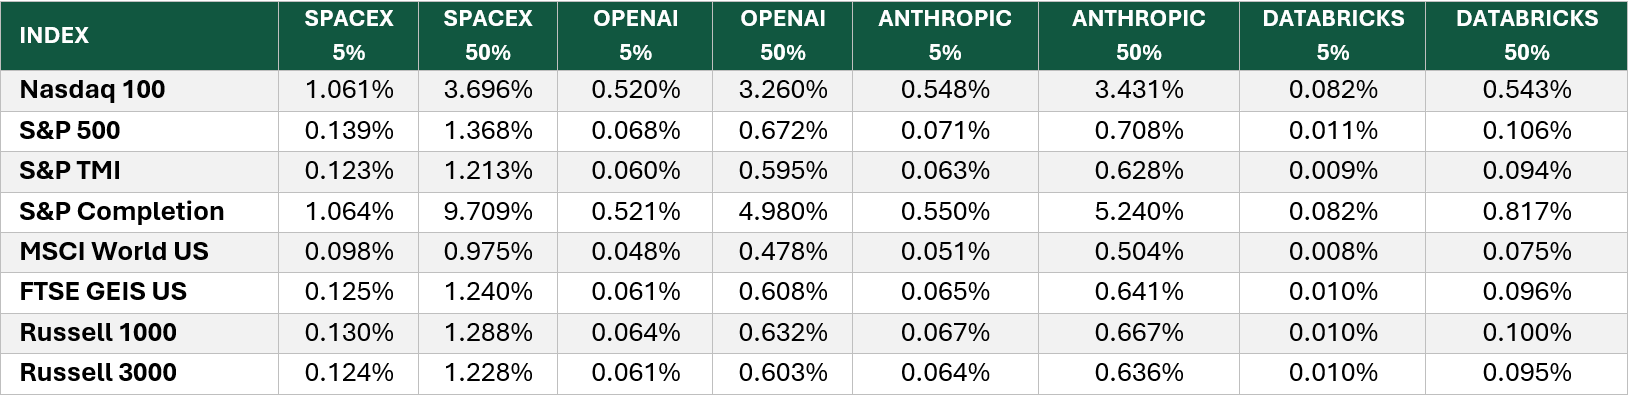
POTENTIAL INDEX IMPACT: WEIGHT SENSITIVITIES AND IMPLEMENTATION WATCHLIST
EXHIBIT 3: INITIAL FLOAT CAN MATERIALLY CHANGE INDEX WEIGHT
INDEX INVESTOR WATCHLIST
- IPO terms: Actual index impact will depend on offering size, initial free float, investable weight factor (IWF), shares outstanding, lock-up structure and trading liquidity.
- Lock-up mechanics: The next major index event may be the float increase, not the IPO. Tranching could reduce concentration risk if providers choose to use discretion.
- Market structure: Large index demand may intersect with limited supply, market-on-close capacity, holidays or broader market volatility. Execution planning and communication will matter.
SPACEX-SPECIFIC WATCHLIST
- Russell US index series: Russell will confirm if the fast entry threshold for inclusion is met after the first day of trading. If fast entry is confirmed, inclusion is expected to occur at the market close on June 26th in conjunction with the Russell Reconstitution effective date.
- Nasdaq day-15 event: Given the June 12 first trading date, day-15 Nasdaq 100 inclusion would fall on July 6. This remains dependent on the actual listing date and final index treatment.
- Early release triggers: Q2 results and price-trigger conditions could unlock up to 30% of Early Release Eligible Shares shortly after the earnings release. Staggered day-70 to day-135 unlocks add further complexity.
- Classification effects: Expected Communication Services GICS treatment, while Russell style classifications are to be assessed.
- Implementation risk: SpaceX may be added initially at IPO float, but the larger index event may be the path from IPO float to eventual free float.
CASE STUDY: MSCI WORLD SCENARIO ANALYSIS
We extend modeling to the MSCI World Index using a 5% and 50% float scenario analysis for SpaceX, OpenAI, and Anthropic. In this analysis, the three-name focus basket would represent approximately 0.20% of MSCI World in the 5% free-float case and 1.20% in the 50% free float case as of May 23, 2026. SpaceX is assumed to be classified in Communication Services while OpenAI and Anthropic are assumed to be classified in Information Technology.
EXHIBIT 4: SECTOR IMPACT WITHIN MSCI WORLD
Source: Northern Trust Asset Management. Illustrative SpaceX weights use the prior two-pager exhibit based on a $1.75 trillion market capitalization and 5% / 50% float scenarios. Actual weights will depend on IPO shares, eligible listed share classes, IWF, capping and provider-specific implementation. The case study presented is for illustrative purposes only and is intended to demonstrate products and services available at Northern Trust. It is based on hypothetical assumptions and scenario analysis and does not represent actual client experience or results. Unless apparent from the context, statements reflect NTAM’s views and are subject to change. No representation is made that any outcomes will be achieved.
EXHIBIT 5: COUNTRY IMPACT WITHIN MSCI WORLD
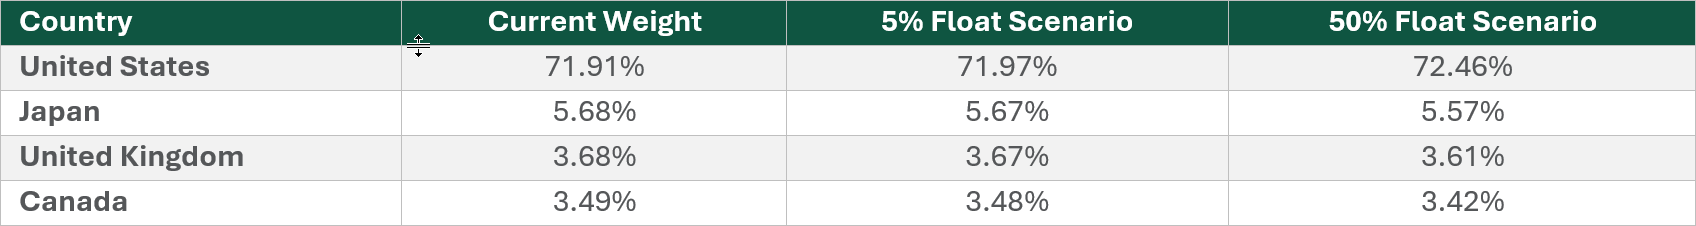
Source: Northern Trust Asset Management. Data as of 5/23/2026. Illustrative SpaceX weights use the prior two-pager exhibit based on a $1.75 trillion market capitalization and 5% / 50% float scenarios. Actual weights will depend on IPO shares, eligible listed share classes, IWF, capping and provider-specific implementation.
At a 50% float, SpaceX enters the MSCI World Index as a Top 10 constituent by weight (0.98% of the Index), displacing JP Morgan Chase (0.96%). For a $1.5 billion portfolio tracking MSCI World, we model exposure to SpaceX, OpenAI, and Anthropic across the two float scenarios (5% and 50%) post lock-up release:
EXHIBIT 6: MSCI WORLD INDEX IMPACT WITHIN MSCI WORLD
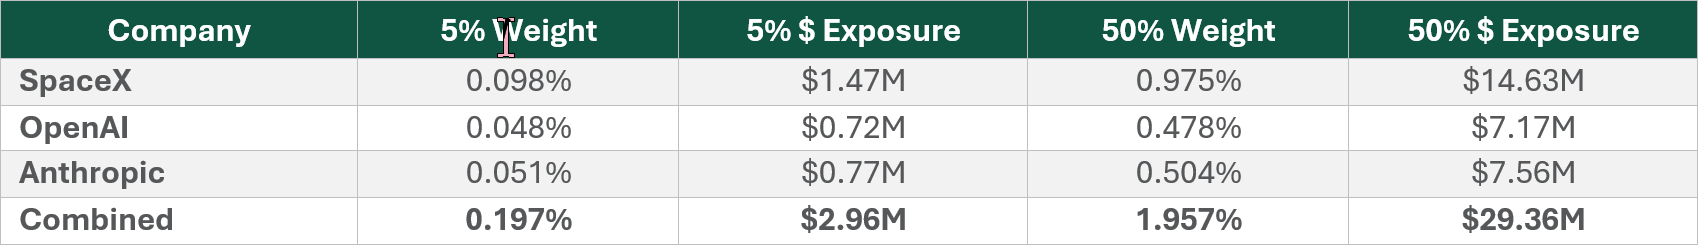
Source: Northern Trust Asset Management. Data as of 5/23/2026. Illustrative SpaceX weights use the prior two-pager exhibit based on a $1.75 trillion market capitalization and 5% / 50% float scenarios. Actual weights will depend on IPO shares, eligible listed share classes, IWF, capping and provider-specific implementation.
BOTTOM LINE
Mega-cap IPOs could create meaningful benchmark events for U.S. and global developed markets index investors, but the impact will be driven by methodology details rather than headlines alone. Clients should expect staggered inclusion across index families, float-driven weight changes over time, and potential implementation complexity around lock-up releases. Disciplined index portfolio management, transparent client communication and careful execution will be essential if these IPOs come to market.
Glossary and Index Definitions
- Initial Public Offering (IPO): When privately owned company sells shares to public investors for the first time.
- Global Industry Classification Standard (GICS): GICS is a four-tiered, hierarchical industry classification system. The four tiers are: Sectors, Industry Groups, Industries and Sub-Industries. All definitions are standardized and applied to companies globally.
- Investable Weight Factor (IWF): IWF represents the percentage of a company’s shares that are actually available to trade in the public market
- S&P 500 Index: The index, a gauge of the large-cap U.S. equity market, includes 500 companies that represent approximately 80% of the market capitalization of publicly traded U.S. equities.
- S&P Total Market Index (“TMI”): is a broad-based U.S. equity market index designed to track the performance of the entire U.S. equity market, including large-, mid-, small-, and micro-cap stocks.
- S&P Composite 1500: is a broad U.S. stock market index combining large, mid, and small-cap stocks to cover approximately 90% of U.S. market capitalization.
- Nasdaq 100: includes 100 of the largest domestic and international non-financial companies listed on The Nasdaq Stock Market based on market capitalization. The Index reflects companies across major industry groups including computer hardware and software, telecommunications, retail/wholesale trade and biotechnology. It does not contain securities of financial companies including investment.
- Russell / FTSE GEIS: Russell is a leading global provider of financial market indices, analytics, and data solutions, operating as a subsidiary of the London Stock Exchange Group (LSEG). It creates and manages thousands of indices—including the renowned FTSE 100 and Russell 2000—used by investors to benchmark performance, manage risk, and create index-tracking investment products like ETFs.
- MSCI: Morgan Stanley Capital International. It is a leading global provider of investment decision support tools, including stock indexes, risk analytics, and ESG performance data. It is best known for creating benchmark indexes like the MSCI World and Emerging Markets indices, which track trillions of dollars in assets.
- Russell 1000: is a market-capitalization-weighted benchmark of the 1,000 largest publicly traded U.S. companies, representing approximately 92–93% of the total U.S. equity market.
- Russell 3000: is a market-capitalization-weighted index tracking the 3,000 largest publicly traded U.S. companies, representing approximately 98% of the investable U.S. equity market.
- FTSE Global Equity Index Series (GEIS) US: is a market-capitalization weighted index that tracks the performance of US large and mid-cap stocks research. It is part of the FTSE Global Equity Index Series (GEIS), which covers approximately 98% of the world’s investable market capitalization.
- MSCI World US: captures large and mid-cap representation across developed markets, covering about 85% of the free float-adjusted market capitalization in each country.
IMPORTANT INFORMATION
Northern Trust Asset Management is composed of Northern Trust Investments, Inc., Northern Trust Global Investments Limited, Northern Trust Fund Managers (Ireland) Limited, Northern Trust Global Investments Japan, K.K., NT Global Advisors, Inc., 50 South Capital Advisors, LLC, Northern Trust Asset Management Australia Pty Ltd, and investment personnel of The Northern Trust Company, The Northern Trust Company (Singapore Branch), and The Northern Trust Company of Hong Kong Limited.
Issued in the United Kingdom by Northern Trust Global Investments Limited, regulated by the Financial Conduct Authority (License Number 191916); issued in the European Economic Area (EEA) by Northern Trust Fund Managers (Ireland) Limited, regulated by the Central Bank of Ireland (License Number C21810); issued in Australia by Northern Trust Asset Management (Australia) Limited (ACN 648 476 019), which holds an Australian Financial Services Licence (License Number 529895) and is regulated by the Australian Securities and Investments Commission (ASIC); issued in Hong Kong by The Northern Trust Company of Hong Kong Limited, which is regulated by the Hong Kong Securities and Futures Commission; and issued in Singapore by The Northern Trust Company (Singapore Branch), which is regulated by the Monetary Authority of Singapore.
For Canada, Asia-Pacific (APAC) and Europe, Middle East and Africa (EMEA) markets, this information is directed to institutional, professional and wholesale clients or investors only and should not be relied upon by retail clients or investors. For U.S. NTAM, the information contained herein is intended for use with all current or prospective clients of Northern Trust Investments, Inc (NTI).
This content may not be edited, altered, revised, paraphrased, or otherwise modified without the prior written permission of Northern Trust Asset Management (NTAM). The information contained herein is intended for use with current or prospective clients of Northern Trust Investments, Inc (NTI) or its affiliates. The information is not intended for distribution or use by any person in any jurisdiction where such distribution would be contrary to local law or regulation. NTAM and its affiliates may have positions in and may effect transactions in the markets, contracts and related investments different than described in this information. This information is obtained from sources believed to be reliable, its accuracy and completeness are not guaranteed, and is subject to change. Information does not constitute a recommendation of any investment strategy, is not intended as investment advice and does not take into account all the circumstances of each investor.
This report is provided for informational purposes only and is not intended to be, and should not be construed as, an offer, solicitation or recommendation with respect to any transaction and should not be treated as legal advice, investment advice or tax advice. Recipients should not rely upon this information as a substitute for obtaining specific legal or tax advice from their own professional legal or tax advisors. References to specific securities and their issuers are for illustrative purposes only and are not intended and should not be interpreted as recommendations to purchase or sell such securities. Indices and trademarks are the property of their respective owners. Information is subject to change based on market or other conditions.
Past performance is not a guarantee of future results. Performance returns and the principal value of an investment will fluctuate. Performance returns contained herein are subject to revision by NTAM. Comparative indices shown are provided as an indication of the performance of a particular segment of the capital markets and/or alternative strategies in general. Index performance returns do not reflect any management fees, transaction costs or expenses. It is not possible to invest directly in any index. Net performance returns are reduced by investment management fees and other expenses relating to the management of the account. Gross performance returns contained herein include reinvestment of dividends and other earnings, transaction costs, and all fees and expenses other than investment management fees, unless indicated otherwise. For U.S. NTI prospects or clients, please refer to Part 2a of the Form ADV or consult an NTI representative for additional information on fees.
Unless otherwise noted, the statements expressed herein are solely opinions of Northern Trust. Northern Trust does not make any representation, assurance, or other promise as to the accuracy, impact, or potential occurrence of any events or outcomes expressed in such opinions.
Forward-looking statements and assumptions are NTAM’s current estimates or expectations of future events or future results based upon proprietary research and should not be construed as an estimate or promise of results that a portfolio may achieve. Actual results could differ materially from the results indicated by this information. Historical trends are not predictive of future results.
Not FDIC insured | May lose value | No bank guarantee